


Ethereum is approaching a crucial technical zone as traders continue to balance cautious market participation with improved price structure. On the 4 hour chart, $ETH After successfully defending the support near $2,300, it built a short-term bullish recovery. This pullback shifted analysts’ attention to the $2,400 resistance area, which could trigger a potential breakout.
Bullish structure builds as we approach major resistance levels
Ethereum recently recovered from the $2,280-$2,300 demand area, improving near-term sentiment. Buyers continue to protect the decline, but a series of higher lows indicates increasing upward pressure. Additionally, the price has regained the $2,310-$2,320 zone, which many traders currently see as an important support floor.
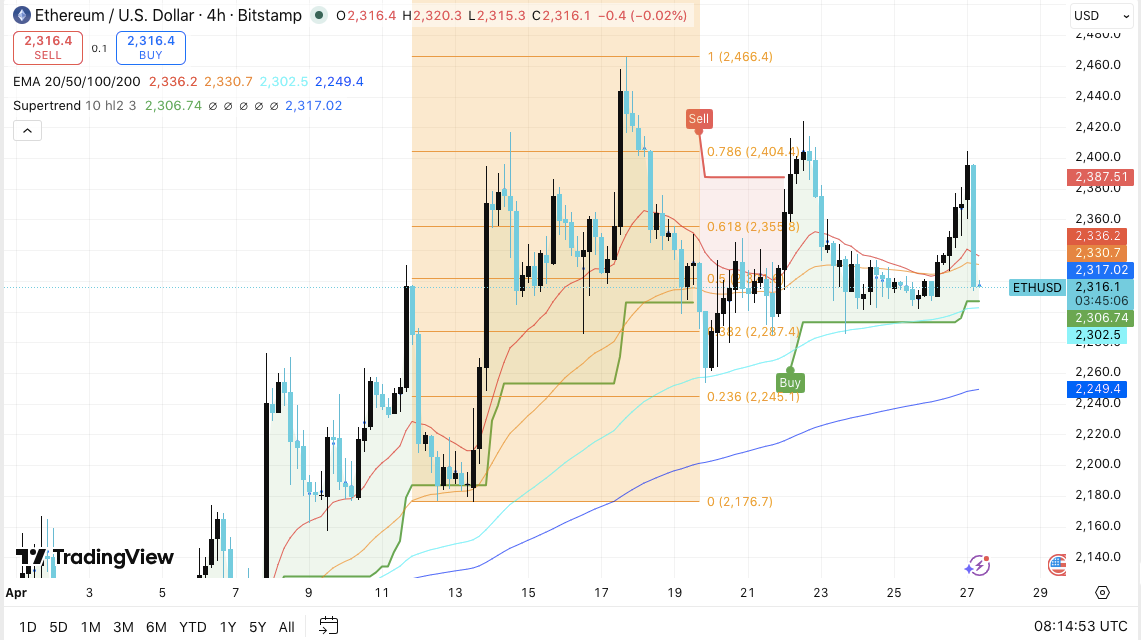
For now, the focus is on the resistance between $2,355 and $2,385. Although upward attempts have slowed in this area, continued compression often precedes stronger expansion. As a result, a move through this band could initiate a test of $2,400 to $2,404, a level that many consider to be the market’s main breakout trigger.
If buyers move above that ceiling, momentum could accelerate towards $2,460 and potentially beyond. Additionally, a bullish EMA correction and supportive supertrend signals continue to strengthen the recovery potential. These signals often attract momentum traders seeking early breakout exposure.
Related: Cardano Price Prediction: ADA Traders Eye $0.261 Breakout Trigger
However, the structure remains vulnerable if: $ETH It loses support at $2,300. A break below that level could expose $2,280, while further decline could send the price heading into the $2,245 demand zone.
Open interest suggests position change, not euphoria
Ethereum’s derivatives market tells a different, but equally important story. Open interest expanded aggressively during the initial rally, but then fell sharply as leveraged positions were unwound. This reset eliminated excessive speculation and reduced the risk of instant liquidation.
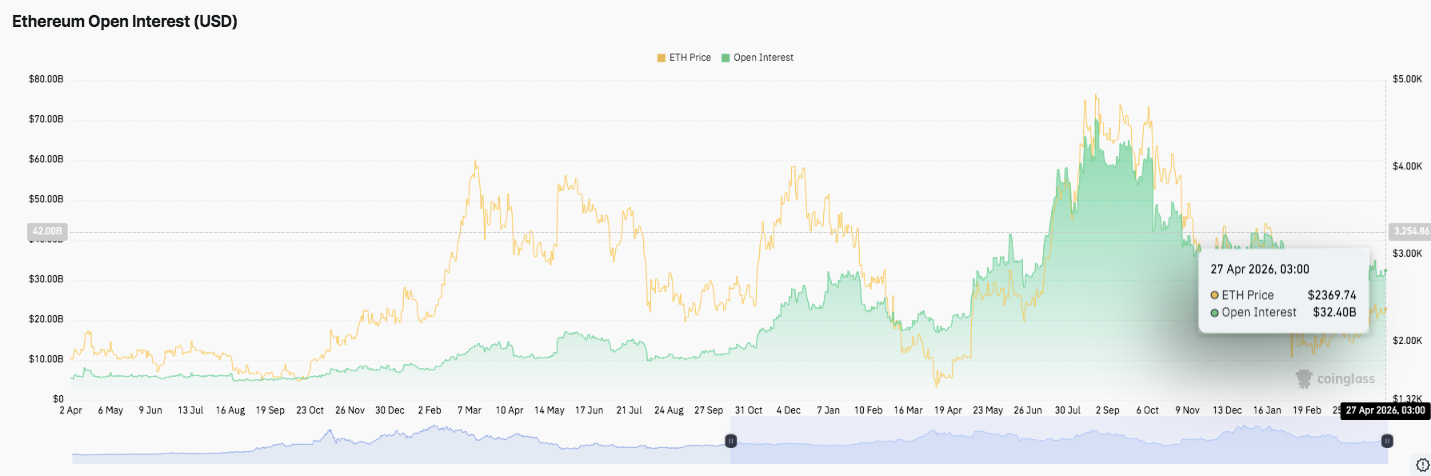
Open interest is currently stable at nearly $30 billion. Importantly, this suggests that traders have entered a phase of repositioning rather than abandoning the market. Many participants appear to be waiting for confirmation before increasing their risk.
This benign backdrop for derivatives could support a healthier rally if spot demand strengthens. Moreover, breakouts supported by measured leverage often prove more sustainable than moves fueled by crowded speculation.
Spot flow reflects attention below the surface
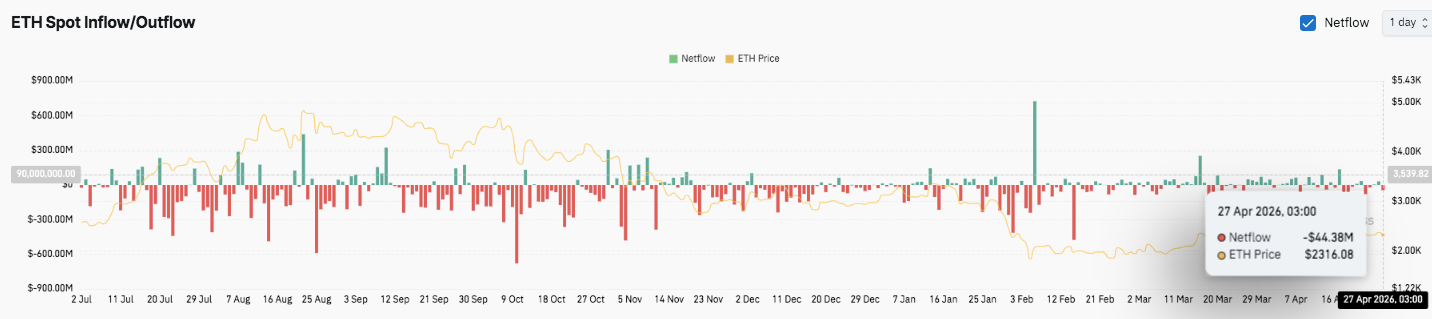
Spot flow data still shows the market is cautious. Outflows have been predominant in recent months, indicating a sustained turnover of capital from Ethereum. Inflows have appeared from time to time, but they have been inconsistent.
Related: Bitcoin price prediction: 3 rejections in 8 sessions to $79,400 as Fed decision looms
Recently, the flow has been approaching neutrality. This change could indicate that selling pressure is easing, even if strong accumulation is not emerging. Therefore, traders are now looking to see if improved price action can attract new spot demand.
Technical outlook for Ethereum price
The major levels are still clearly defined as follows: $ETH We are approaching a decisive stage within the scope of integration.
Top level: $2,355, $2,385, and $2,404 serve as immediate resistance hurdles. A clean break above these levels could begin a stronger rally towards $2,460 and $2,520, where we expect broader supply pressures to emerge.
Lower price level: $2,317 acts as the first significant support, followed by $2,300 as a key bullish defensive zone. Losing this range can put you at risk $ETH There will be a further decline towards $2,280 and $2,245.
Upper limit of resistance: $2,400-$2,404 remains the key breakout barrier and will need to turn to support to confirm medium-term bullish continuation. This level is also consistent with major liquidity clusters where strong reactions are expected.
The technical structure suggests that Ethereum is compressing within a tight consolidation range after a brief recovery from the $2,280-$2,300 demand zone. As a result, volatility has increased and the potential for directional expansion has increased.
Will Ethereum rise further?
Ethereum price direction now depends on whether buyers can maintain momentum above $2,300-$2,317 while challenging the $2,400 resistance zone. Additionally, an improving structure with higher lows suggests that accumulation is gradually forming below resistance.
If the bullish inflows become stronger, $ETH If we secure a breakout above $2,400, the next leg could extend towards $2,460 and even $2,520. This would support the shift from consolidation to expansion.
However, failure to hold $2,300 will weaken the structure. As a result, the price could move back towards $2,280 and $2,245, delaying any breakout attempt.
Related: Solana price prediction: Western Union chooses SOL as price hovers around $85
For now, Ethereum is still in a significant compression zone. Additionally, market sentiment and liquidity flows will determine whether this setup develops into a breakout extension or continues to trade sideways.