


The relationship between Bitcoin and the S&P 500 has ceased to behave like a simple correlation trade at exactly the wrong time for bulls.
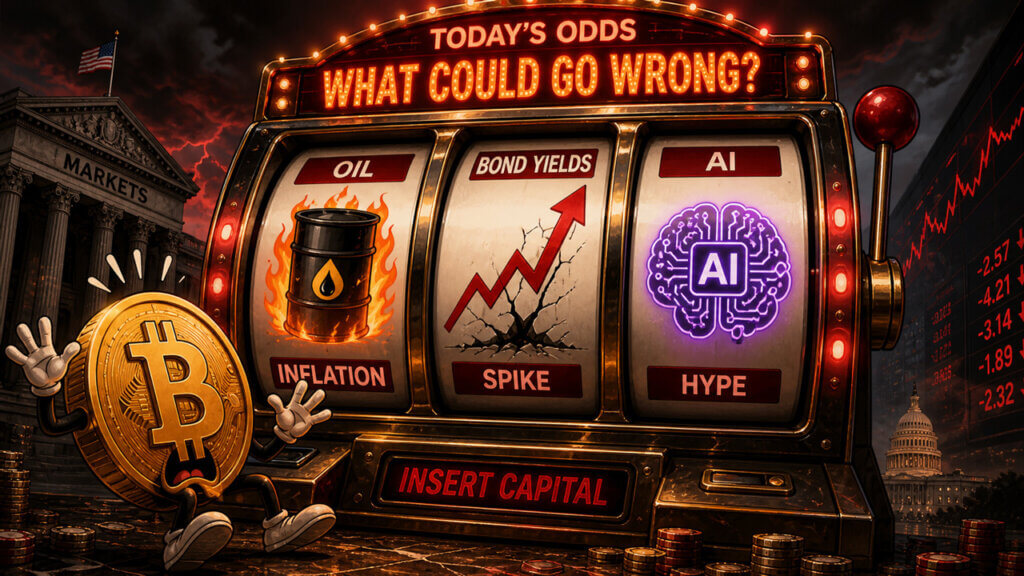
For most of 2026, the logic was clean enough. As oil prices soared during the Iran war, yields rose amid inflation concerns, stocks sold off, and Bitcoin followed suit, as the market treated BTC as a liquidity-sensitive risk asset.
Once the pressure eases, both risk trades could recover together.
That link is now broken. The S&P 500 closed at a new record high of 7,609 on June 2, with recent legs tied to earnings power and AI stocks.
At the same time, Bitcoin is trading around $63,508 as of June 4, down 13% in 7 days, 21% in 30 days, and 49% below its all-time high of October 6, 2025.
Bitcoin isn’t just quietly lagging behind modest stock price gains. Stock prices have fallen sharply while the world’s most closely watched stock benchmarks have risen.
Bitcoin responds to macro signals as much or more than stocks. The pressure is on to prove whether the ETF-era bid that guided the stock from an expected trade in 2023 to a listing in January 2024 and to a high in 2025 is still a marginal buyer.

The S&P 500 correlation made sense.
There is a simple explanation for the correlation mentioned earlier. The same transmission path affected two assets that were becoming liquidity sensitive.
The Iran/Hormuz shock gave markets a physical reason to price in inflation risk. According to EIA data, the total flow of oil through the Strait of Hormuz decreased from 20.7 million barrels per day in the fourth quarter of 2025 to 14.6 million barrels per day in the first quarter of 2026.
The World Bank’s scenario analysis characterizes the disruption as the biggest oil market shock in history, pegging Brent in 2026 at between $95 and $115 per barrel, depending on how the disruption unfolds.
That channel flowed straight into interest rates. The yield on the 10-year U.S. Treasury rose to about 4.45% from 3.96% before the U.S.-Israel attack on Iran, as investors priced in higher inflation and fewer interest rate cuts from the Federal Reserve.
In that setup, Bitcoin can be traded like a stock even though it’s not a stock. High oil prices threatened inflation. Yields rose due to rising inflation. Rising yields have reduced risk appetite. Stock prices fell, and BTC fell with it.

In the early Iran deal rally setup, traders needed evidence of oil flows, gasoline prices, inflation compensation, Fed pricing, etc. to treat this as more than just a bailout deal.
A separate analysis in May noted that Bitcoin’s apparent departure from U.S. stocks may reflect differences in the dominant market at different times of the day, rather than a permanent decoupling.
The after-hours details fit into that framework. Crypto trading over the weekend could outperform US equity desks, especially if oil headlines and interest rate forecasts come true before physical stocks reopen.
Once the S&P 500 begins trading, larger liquidity signals could pull Bitcoin back into the same risk asset channel. That made the previous break vulnerable.
This week’s pattern is more significant. The current move continues beyond the weekend rally and into the U.S. Open. Stock prices are at multi-day highs despite the decline in virtual currencies.
The current break is regarding the buyer
The all-important Bitcoin levels are now below the market, rather than above it.
Bitcoin’s flash crash below $68,000 caused about $400 million in liquidations within an hour, revealing just how crowded the bullish positions were.
This move pushed BTC below several on-chain levels that traders had been eyeing, including near $76,900 on a cost basis for short-term holders and near $78,000 on a true market average.
So my tone changed. Markets that were still trying to see weakness as a upside were suddenly forced to protect their prices.
Current options positioning shows that traders are paying to prevent a fall to $50,000 after BTC falls below $70,000, making $60,000 and $50,000 actual downside markers rather than distant bear market discussion points.
The immediate front is the former $66,900 to $68,000 range. This region was the high end of the 2021 cycle, defined part of the 2024 breakout, and is now testing whether the ETF-era rally can defend the former holdout as support.
A quick recovery would argue that the decline was a liquidation event. If rejected, the downside path will continue to be controlled.
The ETF channel has become the central channel as it has changed the market structure of Bitcoin. The SEC approved Bitcoin spot trading products on January 10, 2024, opening regulated access to BTC through traditional brokerage accounts.
This channel helped turn Bitcoin from a mostly crypto-native cyclical asset to a tradable part of broader institutional investor portfolios.
The same wrapper that created the new demand also made it easier to measure flows. If the Spot Bitcoin ETF is bleeding while AI stocks are rising, there is no need for a major anti-Bitcoin argument.
The marginal buyer just needs to be somewhere else, and the ETF flow table provides daily visibility into that test.

That’s where the AI and mega IPO angle is interesting. SpaceX filed an S-1 with the SEC and S&P Dow Jones Indices discussed changes to mega-cap eligibility, including shortening the IPO seasoning period from 12 months to six months and creating an exception for mega-cap companies.
Nasdaq also conducted a 2026 Nasdaq 100 consultation on very large initial public offerings.
SpaceX’s index path is determined by index provider decisions and timing. The current document indicates methodological pressure rather than automatic inclusion in the S&P 500.
While the S&P is already supported by AI returns, Bitcoin will have to compete for attention, liquidity and risk budget in a market where the excitement lies elsewhere as investors prepare for big AI and space-related listings.
DeFi gives little help to Bitcoin
The broader cryptocurrency context is of little use to Bitcoin.
Institutional blockchain adoption is a reality, but it is increasingly happening through controlled rails. igcurrencynews’s analysis of Wall Street’s on-chain push argued that tokenization could proceed without reviving open DeFi in the way retail users remember it.
This distinction has implications for prices, as tokenized government bonds, managed payment systems, and permissioned market infrastructure create a different feedback loop than the speculative DeFi cycles that once pulled retail liquidity into cryptocurrencies.
DeFi TVL totals nearly $73 million, according to data from DeFiLlama, down from $80 billion in late May and the all-time high of $173 billion in October 2025, and well below the broader risk appetite signals expected by crypto bulls.
Therefore, open DeFi can currently do little to offset Bitcoin’s ETF flow issues.
Security pressures are a further constraint. As Chainaosis highlights increasing pressure from crypto crime across the industry, CertiK has warned that AI is expanding the attack surface for digital assets.

In the case of Bitcoin, while retail DeFi remains depressed, the price of Bitcoin will become more dependent on the return of regulated spot demand as institutional interest in cryptocurrencies shifts to ETFs, tokenized assets, and licensed rails.
Therefore, at the time the first speculation engine is being tested, Bitcoin does not have a second speculation engine. In previous cycles, BTC weakness could still exist alongside rising retail leverage, yield-seeking appetite, and broad altcoin beta.
The current setup is thinner. Tokenization may be expanding, but the capital emerging from it is unlikely to be immediately converted into open crypto risk.
Due to this difference, the appearance of rebound will also change. A recovery in retail DeFi will manifest as higher TVL, greater circulation of stablecoins within open protocols, stronger fee generation, and new leverage across lending and perpetual institutions.
A tokenization-led recovery could lead to balance sheet expansion while public market crypto beta remains fragile. In the case of BTC, this split will keep the watchlist focused on ETF flows, options, and the $66,900 to $70,000 shelf.
two paths from here
Bitcoin is close enough to the major long-term valuation models that it would be naive to assume a straight collapse. It has also been damaged to such an extent that it is premature to think it will recover quickly.
This is where the power law framework comes in handy. Because you can see why the current area has weight.
For those new to the power law, Bitcoin.com’s power law chart describes the model as a log-log price corridor with fair value and band assumptions, but recent market discussions have framed BTC as trading near a historically low power law zone.
The model provides context, not destiny. Stock-to-flow looked strong until it crashed after the 2021 cycle. The power law context makes the $54,000 to $58,000 area more important than random chart levels.
There are currently two reliable paths in the market.
| path | probability | something to prove it | what breaks |
|---|---|---|---|
| Liquidity reset and base | 60% | BTC fails to recover from $66,900 to $70,000, ETF outflows continue, option demand around $60,000 and $50,000 increases, and AI stocks continue to attract marginal risk dollars. | Spot ETF flows quickly turn positive and BTC regains its old shelf with volume. |
| Fast recovery and reconnection | 40% | BTC regains $68,000-$70,000, oil and yields cool, ETF flows stabilize, and movement above cost basis for short-term holders turns the decline into a liquidation reset. | While the ETF redemption continues, BTC loses $60,000 and then the $54,000-$58,000 model/support cluster. |
The first route is more likely because the evidence already points there. Bitcoin has broken through key levels, ETF demand is under pressure, hedges are falling, and stocks are rising for reasons specific to AI income and index flow demand.
A base case reset can occur without a complete bear market collapse. It first shows support testing and base building attempts.
The second path remains valid, as Bitcoin is already trading near an area where long-term models and previous market structure matter.
If there is a quick reversal, sentiment could recover quickly. If BTC recovers $70,000 and the cost basis for short-term holders is near $76,900, this divergence will look more like forced risk aversion than a cycle failure.

Therefore, my previous $49,000 absolute bottom area is positioned as an extension of tail risk rather than a primary prediction.
This theory will gain credence if Bitcoin loses its $54,000-$58,000 cluster, ETF outflows continue after the liquidation event, and AI stock trading continues to absorb capital that would have been returned to BTC.
For now, Bitcoin is testing whether it can rise along with stock prices. It’s also becoming clear how much of the gains in the ETF era were dependent on specific buyers emerging.
The next answer will come from flows and levels, not just the performance of the S&P 500.
(Tag translation) Bitcoin