


Bitcoin has fallen more than 3% in the past 24 hours as traders react to renewed tensions in the Middle East, continued ETF outflows, and fresh declines below key technical resistance zones.
According to data from crypto.news, Bitcoin ($BTC) Prices fell overnight from about $77,880 to nearly $75,220, before recovering slightly towards $75,700 in early Asian trading on May 27th.
Market sentiment deteriorated as reports that the US launched airstrikes near the Strait of Hormuz heightened tensions with Iran and raised concerns that the entire global energy market could be disrupted.
Oil prices rose after the strike, and higher-than-expected U.S. CPI and PPI data earlier this month reignited concerns that inflation could remain high.
Traders are increasingly betting that the U.S. Federal Reserve will hold off on cutting interest rates, a scenario weighing on liquidity-sensitive assets including cryptocurrencies. Although gold rose during the session, Bitcoin failed to break above the psychologically important $76,000 level.
The geopolitical context further strengthened after Iran introduced HormuzSafe, a Bitcoin-denominated marine insurance system designed to facilitate trade settlements outside of traditional banking.
The US Office of Foreign Assets Control warned that the platform could violate sanctions rules, while Iranian authorities threatened retaliation after the airstrike. At the same time, Israeli military operations expanded in southern Lebanon following the breakdown of a temporary ceasefire extension earlier this month.
Spot Bitcoin ETF flows also declined during the latest correction. Several U.S.-listed products posted net outflows in recent trading as institutional demand slowed after Bitcoin failed to rally toward $82,000 earlier this month.
Alex Thorne, head of research at Galaxy Digital, said in a May 26 X post that the market “still has a lot of supply to absorb” around current levels as previous cycle holders continue to sell on the upside.
October to October 2025, 4.45m $BTC Supply is distributed on-chain from the following cost-based cohorts:
0-58.5k: 1.28m $BTC
58.5-66k: 317k $BTC
82-83.5k: 50k $BTC
93.5-94.8k: 75k $BTC
96-101k: 434k $BTC
103.6-111k: 430k $BTC
111k-125.3k: 1.837m $BTCout of 4.45 meters $BTC It was distributed, half came from… pic.twitter.com/aP33CnKIXb
— Alex Thorne (@intangiblecoins) May 26, 2026
Thorne added that it’s about 4.45 million people. $BTC Coins have likely changed hands since the flash crash on October 10, 2025, with the majority of coins issued from wallets that last held Bitcoin for over $103,600.
According to Galaxy data, approximately 36% of the supply transferred during this period came from holders with a cost base of less than $66,000, including dormant wallets that have been inactive since before the FTX collapse in November 2022.
Meanwhile, BlackRock’s iShares Bitcoin Trust ETF gained attention earlier this month after it reported $1.29 billion in block trades. Thorne said the trades could signal that some institutional investors are reducing their exposure as Bitcoin remains well below its all-time high of around $124,000.
Bitcoin Still Trapped Between Liquidity Cluster and Major Resistance Level
The daily chart shows Bitcoin losing momentum after falling below the ascending parallel channel that led the price rally from April to early May. This breakdown occurred after repeated rejections near the top boundary of the structure, where the seller aggressively defended the $82,000 area.
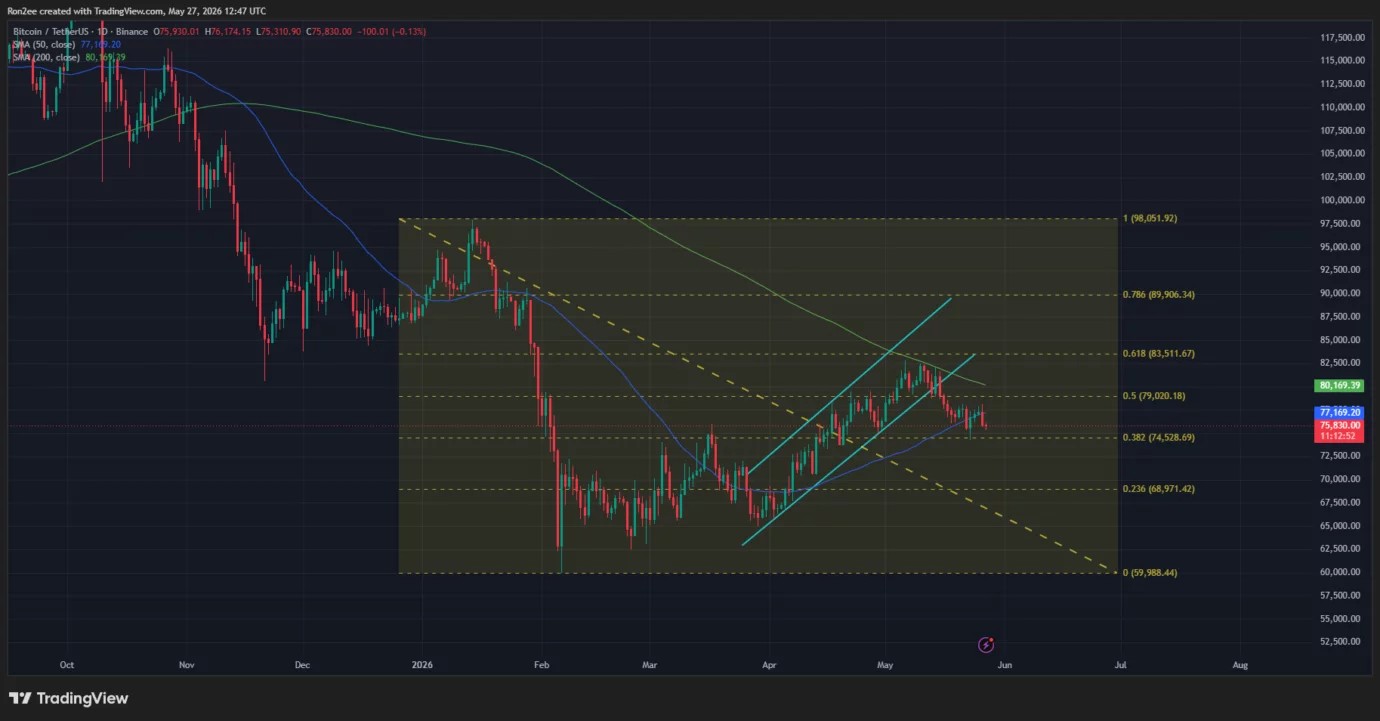
The Fibonacci retracement level from the February low near $59,988 to the May rebound high near $98,051 places immediate support near the 0.382 level at $74,528. The 0.5 retracement near $79,020 is currently acting as short-term resistance, while the 0.618 level at $83,511 is roughly in line with the bullish target zone that many traders continue to monitor.
The 200-day simple moving average near $80,169 has also capped any upside attempts over the past few sessions. Bitcoin briefly rose above the average earlier this month, but sellers regained control and brought the price back below the index. The 50-day moving average has started to decline as short-term momentum has weakened following the rejection near $82,000.
The structure of the weekly chart is putting additional pressure on the bulls. Bitcoin remains well below the cycle high near $124,000 recorded earlier this year, while the weekly MACD reading continues to show negative momentum despite the bounce from the $60,000 area.
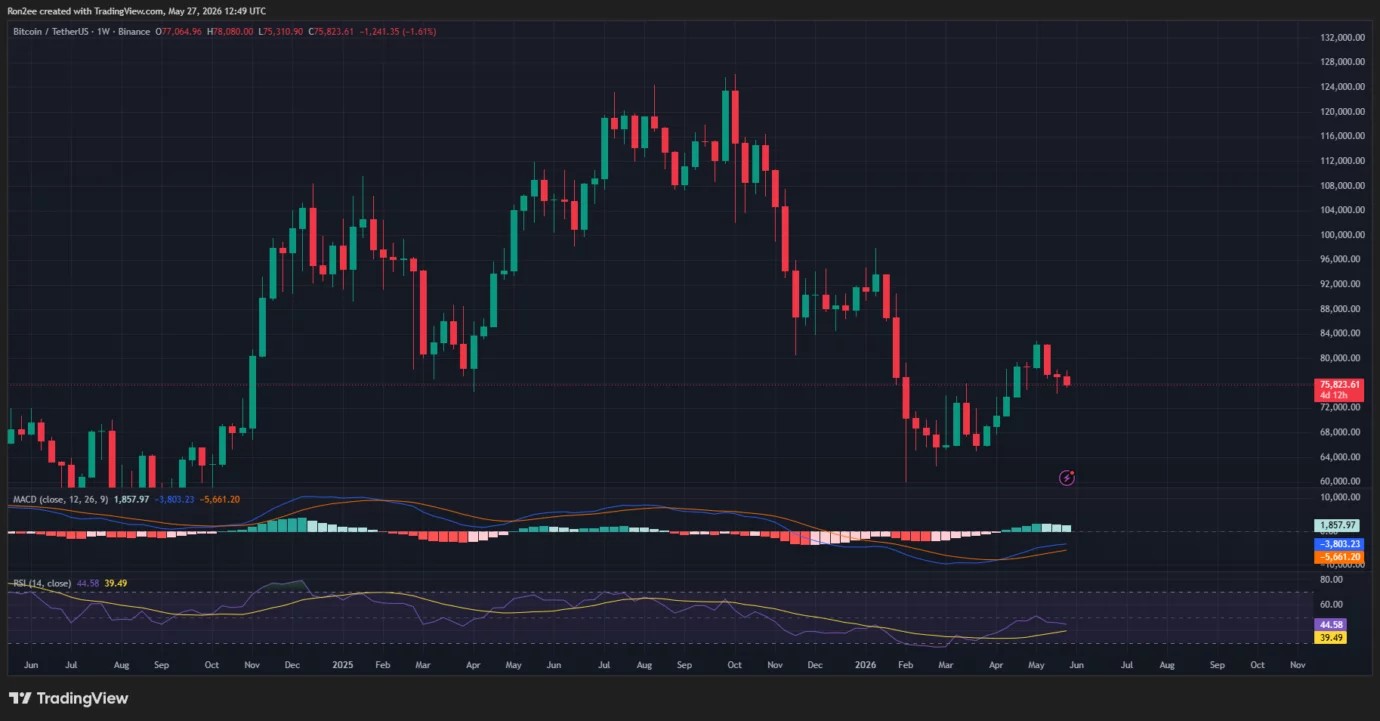
The RSI reading around 45 has not yet crossed bullish territory, leaving the market without confirmation of a trend reversal on the higher time frame.
Derivatives positioning also indicates increased volatility around current levels. CoinGlass’ liquidation heatmap shows a cluster of leveraged short positions between $77,800 and $78,500, with additional liquidity piling up around the $80,000 and $81,000 levels. These zones have repeatedly attracted prices during intraday movements as market makers seek leveraged positioning on both sides.
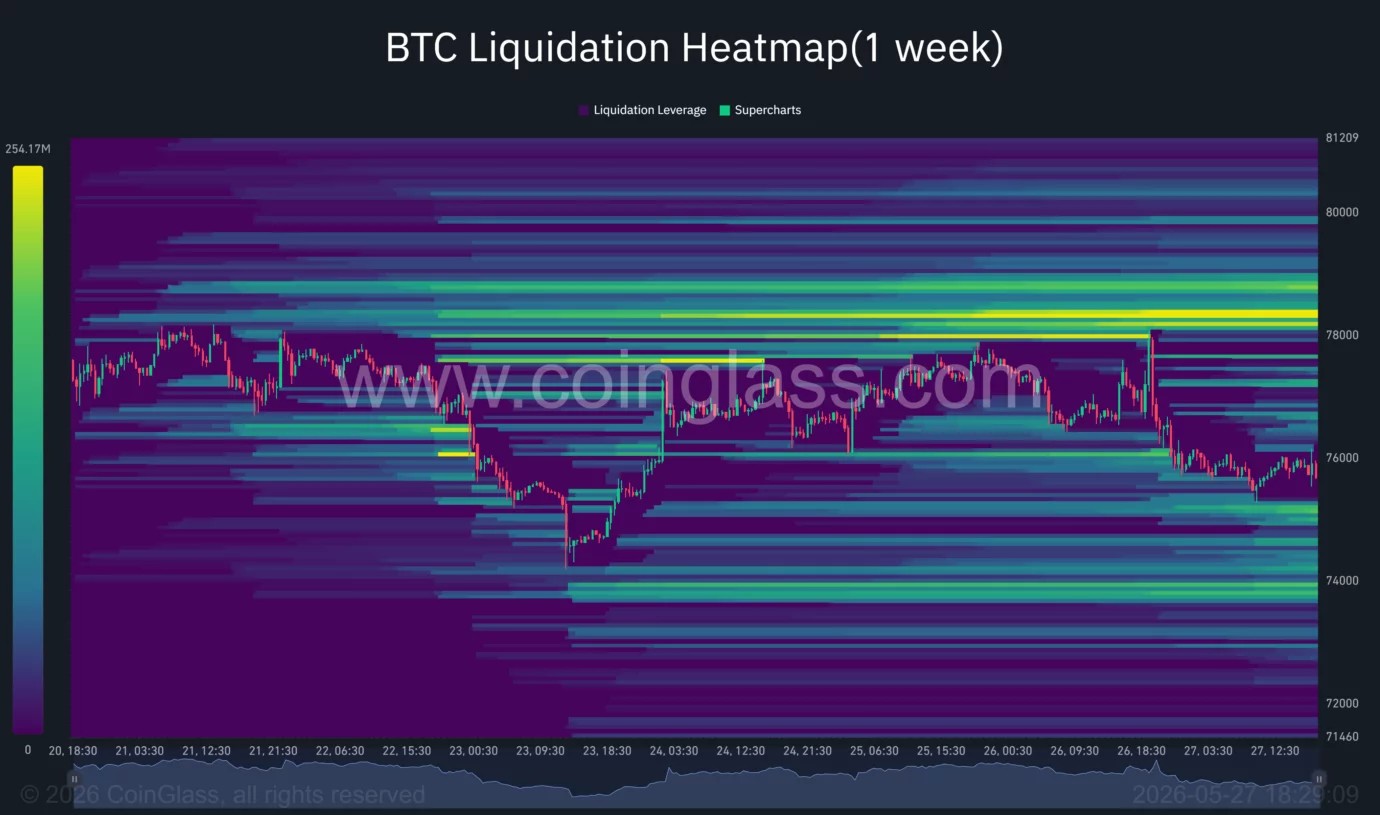
Below the current price, there are still major liquidation pools around $74,000 and between $72,000 and $73,000. Support near $75,000 is likely to fail during future trading as Bitcoin is unable to regain the higher liquidity zone despite several attempts, increasing the risk of further significant declines.
In a May 26 post on X, cryptocurrency analyst Crypto Candy said that despite the recent selloff, Bitcoin continues to outperform key demand zones.
“So far, the situation has not changed much. $BTC scenario. It is still above the 76,000-74,000 demand zone and is attempting to rebound. As long as this zone lasts, we are still hopeful $BTC Reach the 83k-85k area. Exiting below the demand zone invalidates this bias,” the analyst said.
$BTC
So far, not much has changed $BTC scenario. It is still above the 76,000-74,000 demand zone and is attempting to rebound. As long as this zone lasts, we still hope $BTC Reach the 83k-85k area. This bias is disabled below the demand zone.
I’ll try it… https://t.co/ahdwK1VhG2 pic.twitter.com/Vof0hRV1ZJ
— Cryptocandy🔥💎 (@cryptocandy24x) May 26, 2026
Meanwhile, analyst BitcoinHyper outlined a more cautious short-term scenario, suggesting that Bitcoin may be forming an ABC correction structure following its recent rejection near $82,000. According to analysts, $BTC A rebound towards the $79,000 area is likely first before a further leg decline could potentially propel the price towards $71,000.
A drop below $74,000 could result in a lower support zone.
A decisive move below the current demand zone will weaken the remaining bullish structure on both daily and weekly time frames. Traders continue to keep a close eye on the $74,000 area. This is because this area coincides with the lower bound of the recent consolidation, the 0.382 Fibonacci retracement level, and a large concentration of leveraged long positions.
Further downside could expose Bitcoin to a move towards the March accumulation area around $68,900, where the 0.236 Fibonacci retracement currently sits. Historical volume profiles also show increased spot activity around that range following the February liquidation cascade earlier this year.
Open interest in Bitcoin perpetual futures contracts also remains elevated despite the latest correction. Traders continue to leverage high leverage around local support and resistance zones, increasing the likelihood of sharp liquidation-driven moves should future macro events or geopolitical headlines increase volatility.
For now, Bitcoin is stuck between stiff resistance around $78,000 to $80,000 and weak support around $74,000 to $75,000. Until one or the other breaks down definitively, traders will likely continue to focus on liquidity sweeps, ETF flow data, and macro headlines rather than certainty in the long-term direction.


