


After suffering one of the steepest declines this year, Bitcoin has made a solid recovery to above $62,000. This move capped a two-week rally from the lows, and the standout feature on the chart is clear. The $58,000 level has now been defended twice, turning what looked like a breakdown risk into a well-defined buy zone.
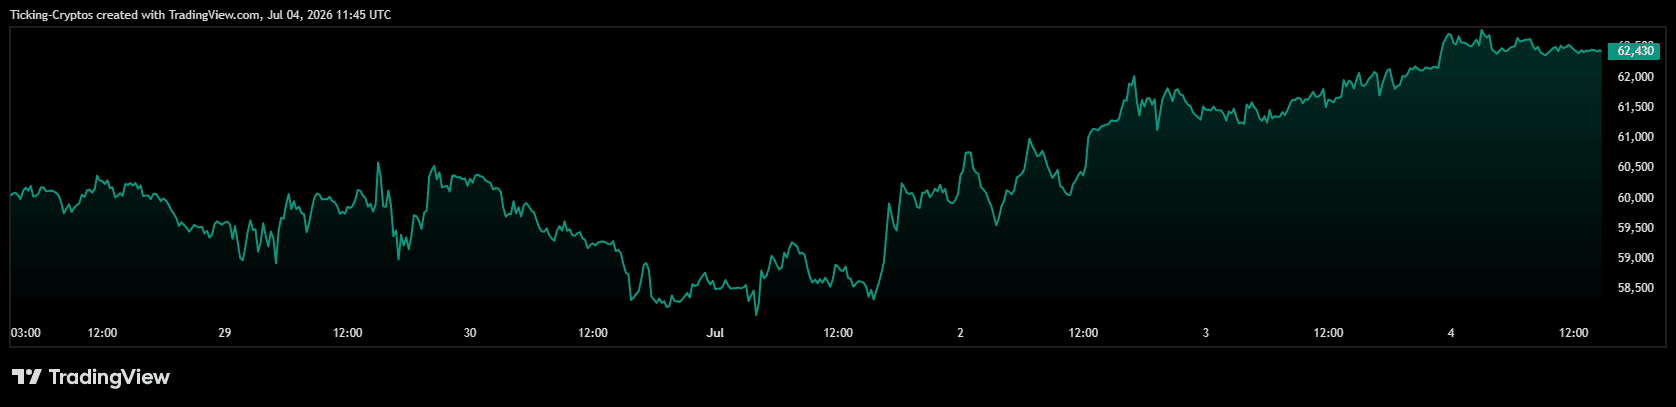
This recovery coincides with broader changes in market structure. Buyers intervened aggressively around $58,000 to $60,000, the recovery volume held, and the short squeeze forced the unwinding of bearish positions, liquidating hundreds of millions of dollars of shorts across the market. Underlying this lies a slow but real repositioning of flows as European traders move away from Brexit platforms towards fully regulated MiCA compliant venues.
Why did Bitcoin recover above $62,000?
The rebound was driven by a combination of macro relief and forced buying. The Fed’s inflation-easing message eased fears of further hawkish policy and encouraged a return to risk assets. This macro spark hit a market that had been heavily shorted after the June selloff, and the result was a classic short squeeze: bearish bets liquidated, fueling a rally.
But the more structural story is where the buying is coming from. With MiCA now fully enforced across the EU, unlicensed platforms are turning away from European users. A wave of traders who held their funds on the exchange are leaving the region, including some who are liquidating many positions on Binance and moving their cryptocurrencies to regulated alternatives. Part of that transition is manifesting itself in new accumulations. A portion will be redeployed when the balance is transferred and redeployed to a compliant exchange. $BTC It’s not sitting idle and it’s somewhere around the $58,000-$60,000 zone.
In other words, some of this recovery is not purely speculative, but reflects portfolio adjustments and re-entry purchases by users transferring their holdings during the regulatory transition.
What is the Bitcoin chart showing now?
The most important structure on the 2-hour chart is $58,000 support line (yellow). Price severely tested this zone twice – once during the late June flush and the second time around early July – and buyers aggressively defended this zone both times (highlighted on the chart). This double defense converts $58,000 from a nervous line to a confirmed demand zone.
Key areas on the chart:
- $65,581 (white line): To confirm a complete trend reversal, the bulls will need to regain the major overhead resistance and bullish levels. This is roughly in line with the widely followed 50-month EMA.
- $62,000 – $63,000: Current trading zone. $BTC After pushing through the recovery, things are stabilizing here. Staying above $62,000 keeps the short-term structure constructive.
- $60,000 (psychological): It is the first line of short-term support and the top of the demand zone.
- $58,000 (yellow line): Important support that has now been held twice. If you lose when volume is high, you will be exposed to downside risk again.
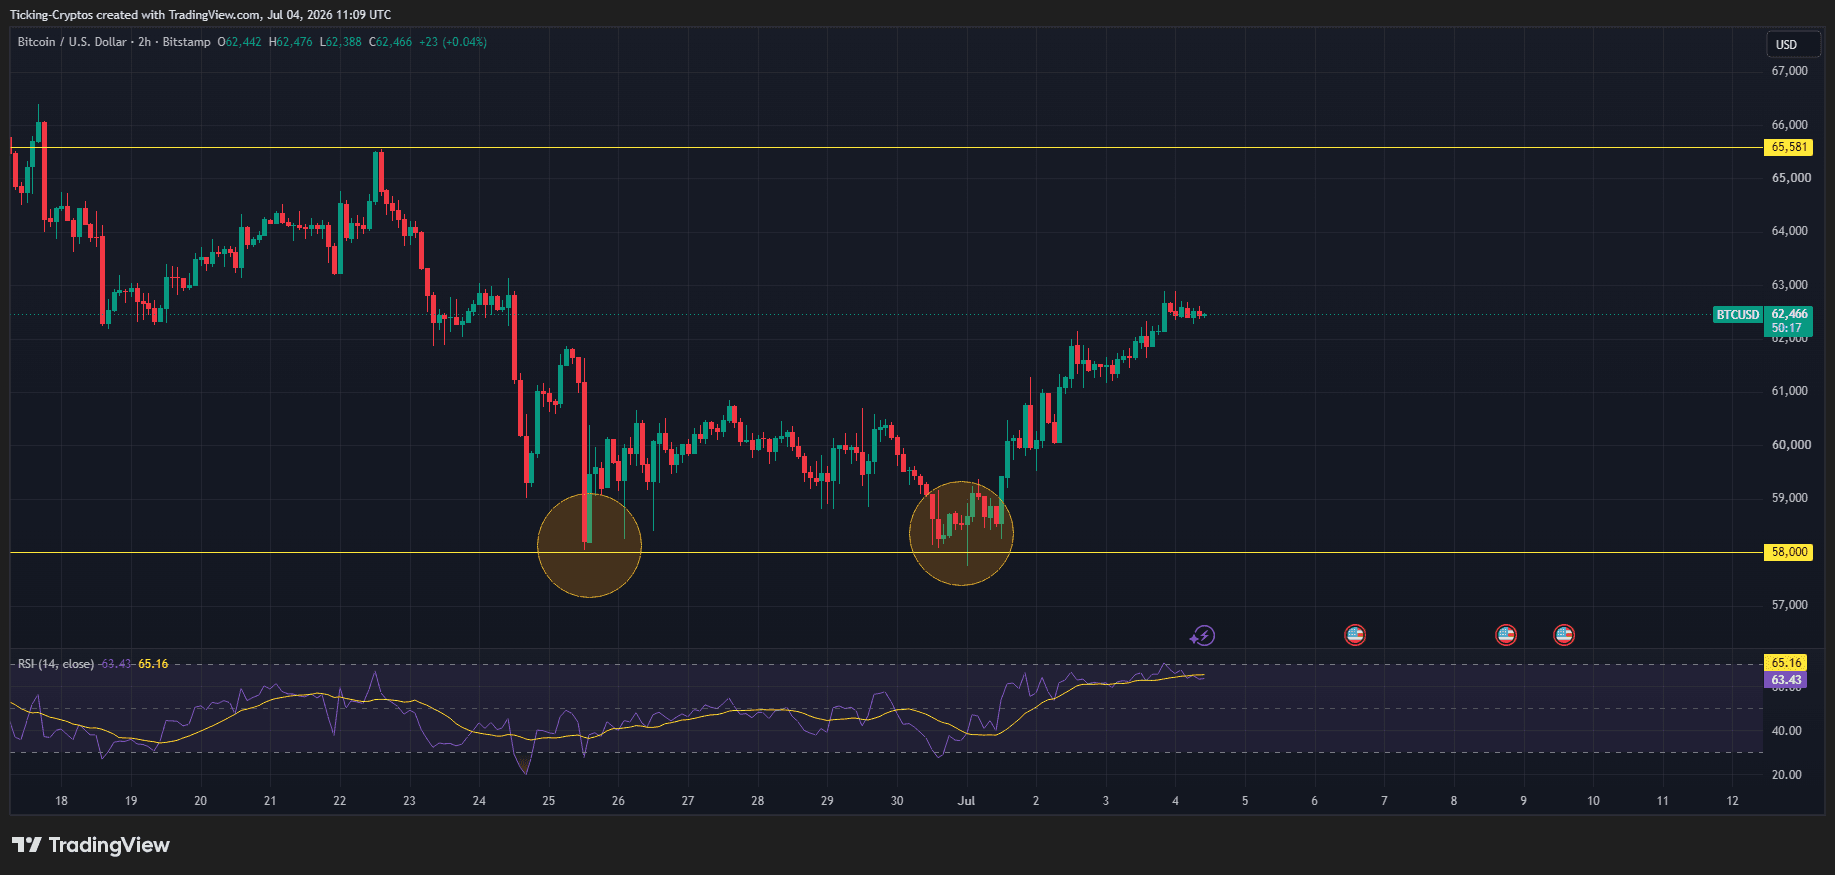
Momentum has recovered significantly. The RSI (14) has risen to around 65 and is trending above the moving average. It’s not oversold, but it’s not in overbought territory yet. This leaves room for further upside before momentum becomes a concern.
What is the next Bitcoin price target?
- Bullish scenario: only for $BTC If the level remains above $60,000, the path of least resistance is $63,000 – $65,000 resistance band. Clean break and close on top $65,581 That’s the confirmation the bull wants, $67,000-$70,000 within the next few weeks. If momentum builds, the liquidation cluster near $67,600 could act as a magnet as short sellers come under pressure during the rally.
- Bearish scenario: If rejected in the $63,000 to $65,000 range, the price will be retested at $60,000 and then $58,000 support. The line in the sand is clear. A decisive break below $58,000 with strong selling volume would weaken the entire setup and expose Bitcoin to a move towards the $55,000 zone. Friday’s macro data and continued ETF flow trends remain the key movers.
Bottom line: Holding $58,000 is the foundation of this recovery. As long as that floor holds, a drop from $58,000 to $60,000 will be treated as a buying opportunity rather than an exit signal.
Binance Where are traders moving after Brexit?
As MiCA reshapes the European landscape, one of the most common questions right now is where to go to buy and hold Bitcoin in a fully regulated and compliant place. For many EU and UK users looking to transfer their holdings, Coinbase has become a leading regulated alternative that is listed, licensed, and built around consumer protection.
- Cryptocurrency trading is not suitable for everyone as it is highly risky and can result in the loss of your entire investment.
- Information is provided for informational purposes only and does not constitute investment advice. This is not a recommendation to buy or sell any particular digital asset or to adopt any particular investment strategy.
- Coinbase offers simple and sophisticated trading in eligible jurisdictions. Advanced trading is for experienced traders and is subject to trading rules. The two platforms have different pricing. Manufacturer fees are determined by quantity.
- Staking is available only in eligible jurisdictions and on eligible networks. Reward rates are based on estimated protocol rates and are subject to change. Terms and conditions apply.


