

Bitcoin is struggling to clear $80,000 as the rally is not sustained by strong spot buying. Currently, the price is barely holding at $79,000, and while it may look stable on screen, the market underneath is thin.
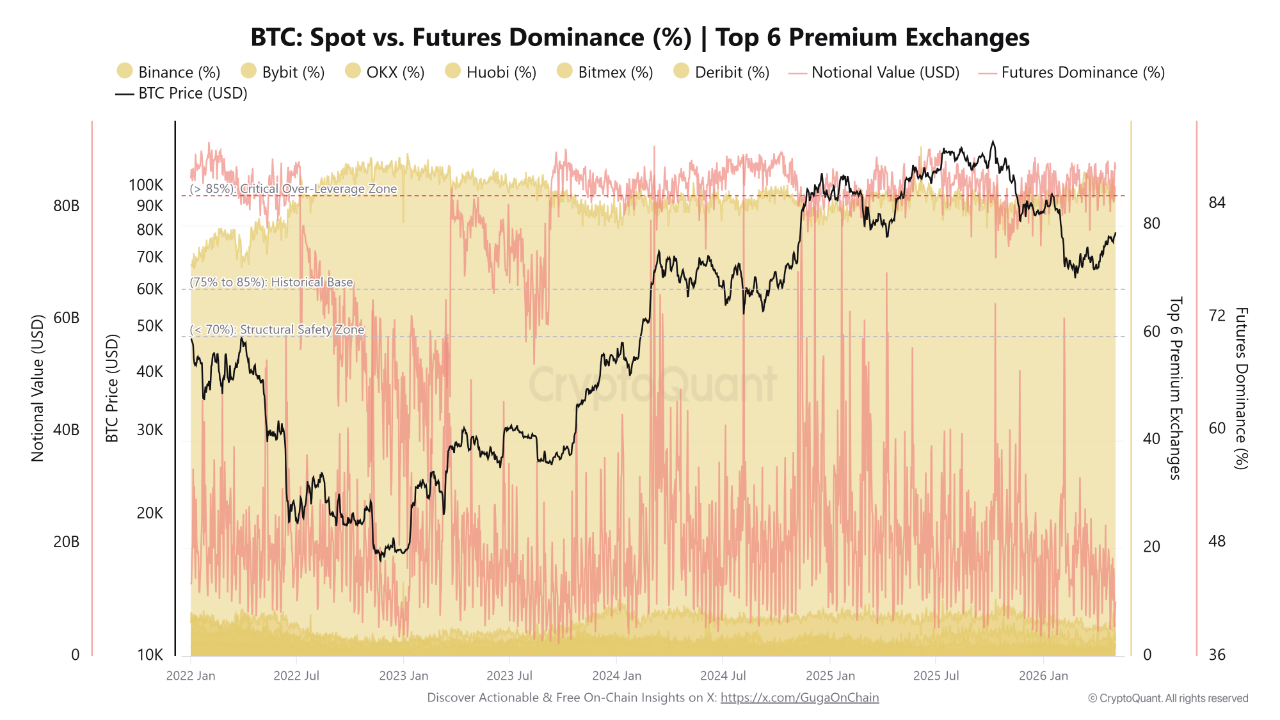
The main caveat is simple. This means that futures are doing almost all the work. Currently, derivatives trades account for 87.77% of trades across the top six premium exchanges. This puts Bitcoin in a high leverage zone where one bad flash can quickly turn a calm price trend into chaos.
The estimated total amount is approximately $9.73 billion, but actual spot demand has almost disappeared. Although Binance is not listed, it holds 87.22% of the total liquidity. Deribit is also a private company and does not exhibit strong hedging flows that would indicate a larger institutional position. This setup is similar to a retail trader who maintains Bitcoin with debt, margin, and hope.
Derivatives traders keep Bitcoin near $79,000 as real spot demand dries up
On April 30th, Julio Moreno, Head of Research at CryptoQuant, warned in his weekly report that the rally towards $79,000 was driven by derivatives as spot demand declined.
Mr. Julio’s first three points are in line with the futures lead of 87.77%, meaning this rally was not built on broad cash buying. A similar divide appeared before the 2022 crash.
CryptoQuant Bull Score also dropped from 50 to 40, falling below neutral and back into bearish territory. The decline came after futures-driven price action weakened overall market conditions.
Price increases lacked solid support from physical buyers as apparent demand remained negative throughout the April rally. That’s the problem with cow traps. Prices may rise, but the floor underneath is not strong.
A new warning has been added to the daily chart. Bitcoin formed a shooting star candle after breaking out of its bullish channel. This pattern is often seen when buyers push the price up, but then sellers push the price back down before the session ends.
Price is currently sitting in an old resistance area that has turned into support, but that support is not convincing. Actual volume is now 15.78K $BTCabove its 20-day average of 13.87,000. $BTCyet selling pressure still won that round.
Short-term pressures are also building beyond the market. Price momentum decreased by 3.5%, net long pressure decreased by 28.6%, and trading activity decreased by 13.3%. Sellers are more active, but volume is weaker. This indicates a decline in investor engagement, with Bitcoin remaining in volatile territory and increasing consolidation risk.
Option traders are also paying more attention to downside risk. 25 Delta Skew rose 6.75%, while options open interest fell 9.98%. Volatility spread increased by 173.4%. This means that the market is pricing in a much higher expected risk than the risk already seen in the actual trade.
Short-term Bitcoin holders account for the majority of foreign exchange inflows as ETF demand weakens
Wall Street kids aren’t giving Bitcoin a clean shot either. US spot Bitcoin ETF MVRV points out the possibility of profit taking. ETF products saw net outflows of $783.4 million, with volume down 13.45%. This indicates weak institutional demand, increasing the risk of a sideways trade or further decline.
On-chain activity is mixed. Daily active addresses increased by 6.4%, with more wallets becoming active. However, firm-adjusted remittance volumes fell by 7.4%, meaning large-scale trading activity cooled.
The LTH/STH SOPR ratio bottomed out around 0.99 on April 24th and April 25th, meaning long-term and short-term holders were barely breaking even at that point. It then rose to 1.097, indicating that long-term holders are spending the coin at a better profit level than short-term holders.
Selling pressure is primarily coming from new buyers. According to the exchange’s inflow data, 97.2% of the coins sent to the exchange came from addresses of short-term holders. 1 to 1,000 medium holders $BTCFish, often called fish or sharks, accounted for about 58% of the inflow.
Small holders known as shrimp and crabs accounted for 18.5%. The number of inflows reached 35,649 on April 24th. $BTC in one session. By May 3, that had fallen to 3,895 people. $BTC.
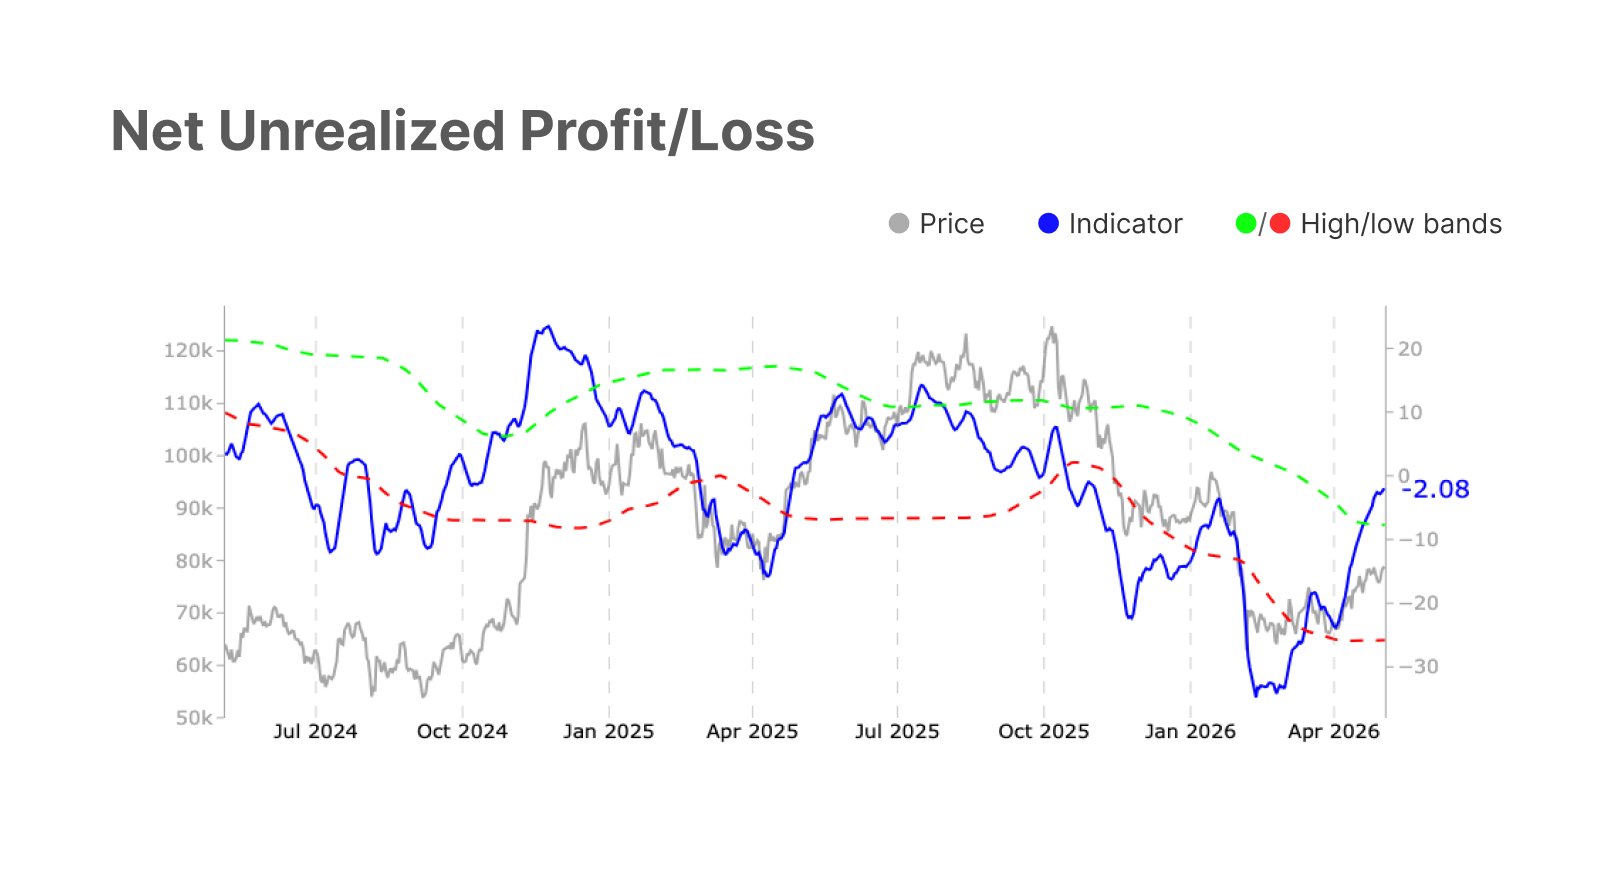
Short-term holders are down an average of 2.17%, and their losses are narrowing, while long-term holders are still up 27%. New buyers also recovered profits, and market sentiment returned to “optimism/recovery” for the first time in weeks.