


Bitcoin’s latest price action shows the market is at a key decision point as bullish momentum slows below a large resistance ceiling. While the broader structure remains in favor of buyers, recent data points to a cautious shift. Traders are now looking to see if Bitcoin can sustain its uptrend after weeks of strong gains, or whether it can enter a deeper downtrend.
Bullish structure faces near-term pressure
Bitcoin continues to record highs and lows on the 4-hour chart, confirming a sustained uptrend. The rise from the $66,000 area to $79,000 highlights strong recovery momentum. Additionally, price is above major moving averages, reinforcing bullish control across multiple time frames.
However, that momentum is now showing signs of slowing near the $80,000 resistance level. Recent candlesticks have shown hesitation, with buyers struggling to overcome this psychological barrier. As a result, the market entered a correction phase just below the resistance level.
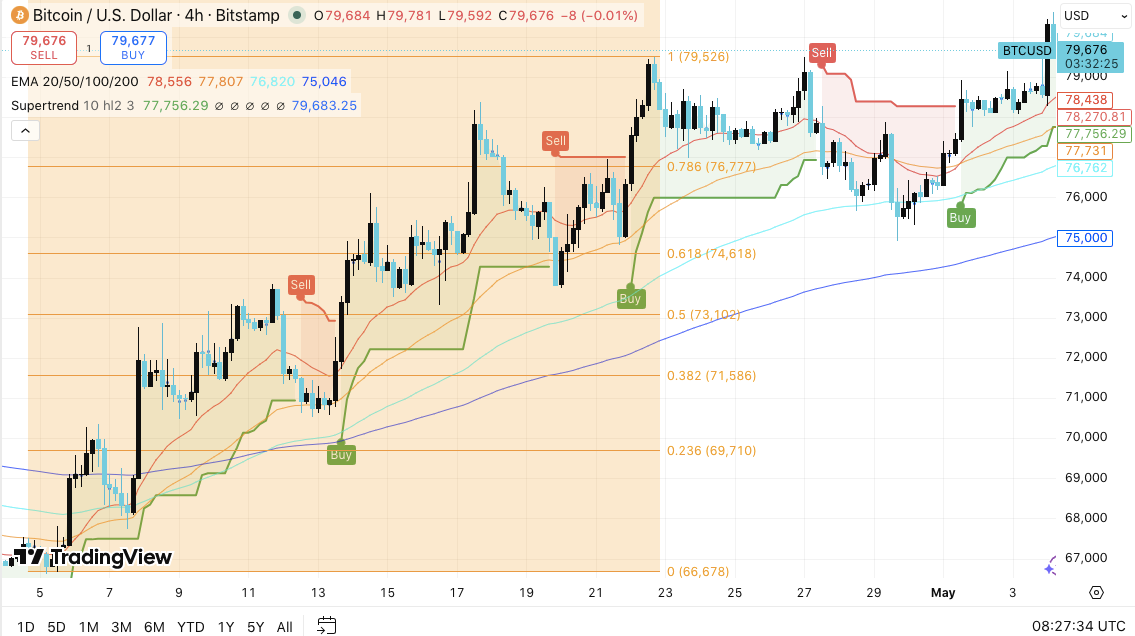
Immediate support lies between $78,200 and $78,400, centered on short-term structure and the EMA cluster. Additionally, the $77,300 to $77,700 range provides dynamic support for the midrange consolidation zone. A further decline towards $76,700 would test an important defensive range for the bulls.
Key Resistances Hold Down the Market
Bitcoin continues to be under strong selling pressure near the $79,500 to $80,000 level. This zone has repeatedly rejected price increases and has become a definitive breakout level. A successful move above $80,000 could trigger fresh upward momentum towards $81,000 and even $83,000.
Related: Dogecoin price prediction: Nasdaq lists first-ever DOGE mining company as price breaks out of descending channel
However, if the pair fails to break through this level, sentiment may change. A break below $77,000 will weaken the bullish structure in the short term. As a result, the price could revisit lower support near the $75,000 level or even the $74,600 Fibonacci retracement level.
Derivatives and Spot Flow Signal Cooling Activities
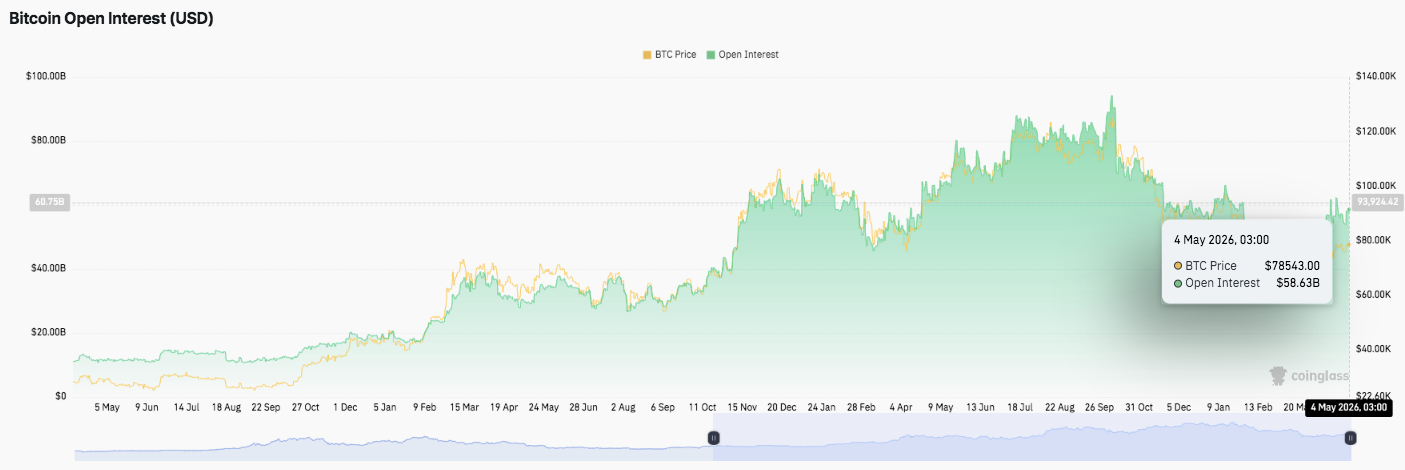
Trends in open interest reveal broader changes in market behavior. Previously, open interest rose above $80 billion, confirming strong participation and active positioning. However, the recent decline towards the $50 billion to $60 billion range indicates position unwinding and profit taking.
Furthermore, this decline suggests that traders are reducing leverage after a hot phase. The market currently appears to be stabilizing, reflecting a more balanced positioning environment.
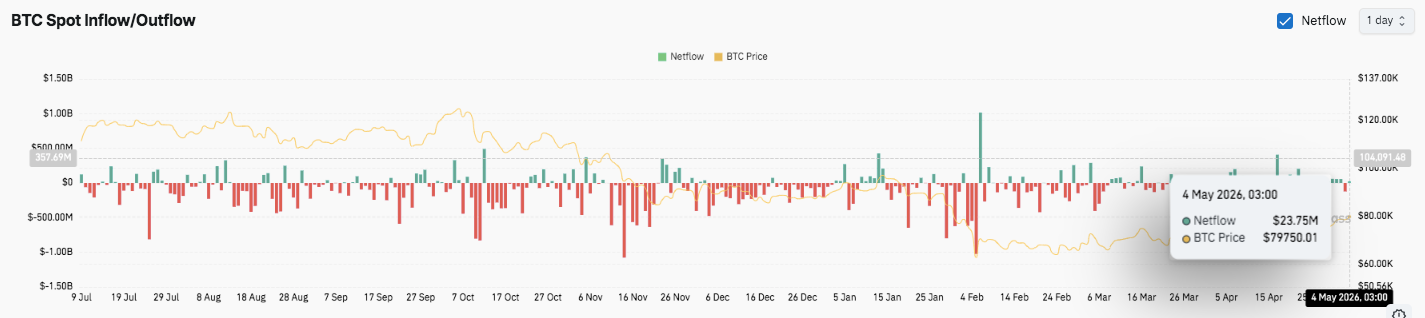
Spot flow data further supports this transition. Up until now, it has been pointed out that the outflow of funds was due to the impact on distribution due to falling prices. However, recent activity has been a mix of inflows and outflows, indicating indecision. Additionally, intermittent inflow spikes suggest selective accumulation during dips.
Related: XRP Price Prediction: Bearish Structure Tightens as Bears Hold Below $1.42
Technical outlook for Bitcoin price
The major levels remain well defined as Bitcoin trades just below the major breakout zone.
Top level: $79,500 and $79,800 are the immediate hurdles. If confirmed above $80,000, it could open the way to $81,000 and $83,000. If momentum strengthens, the price could continue to grow towards $85,000.
Lower price level: $78,200 acts as initial support, followed by $77,300 and $76,700 as stronger demand zones. A loss of $76,700 weakens the short-term structure, resulting in losses of $75,000 and $74,600.
Upper limit of resistance: $80,000 remains a major psychological and structural barrier. A sustained move above this level would confirm continued bullishness in the medium term.
Technical settings suggest that Bitcoin is compressing just below resistance after a strong rally. This range formation is often preceded by increased volatility, especially when coinciding with momentum cooling and leverage reduction.
Will Bitcoin surpass $80,000?
Bitcoin’s near-term outlook will depend on how the price reacts near the $80,000 ceiling. If the buyers defend the support at $78,200 and gain momentum, a breakout becomes increasingly likely. As a result, increased inflows and increased participation could increase pressure above $83,000.
However, if it cannot exceed $77,000, it would indicate a decline in demand. This scenario could trigger an even deeper decline towards $76,700 and even $75,000. Additionally, the decline in open interest suggests traders are reducing risk, which could delay any aggressive upside move.
Related: Cardano Price Prediction: ADA Pushes CRT High to $0.2561 as Foundation Announces Digital Trust Framework
For now, Bitcoin remains in the critical zone. Price compression, mixed spot flows, and slowing momentum all indicate that a decisive move is imminent. The next breakout or rejection could determine the direction of the market in the coming sessions.