


Bitcoin price continues to rise above $113,500. A clear move above the $115,750 resistance could lead to further gains for BTC.
- Bitcoin has started a new rally above the $114,000 resistance level.
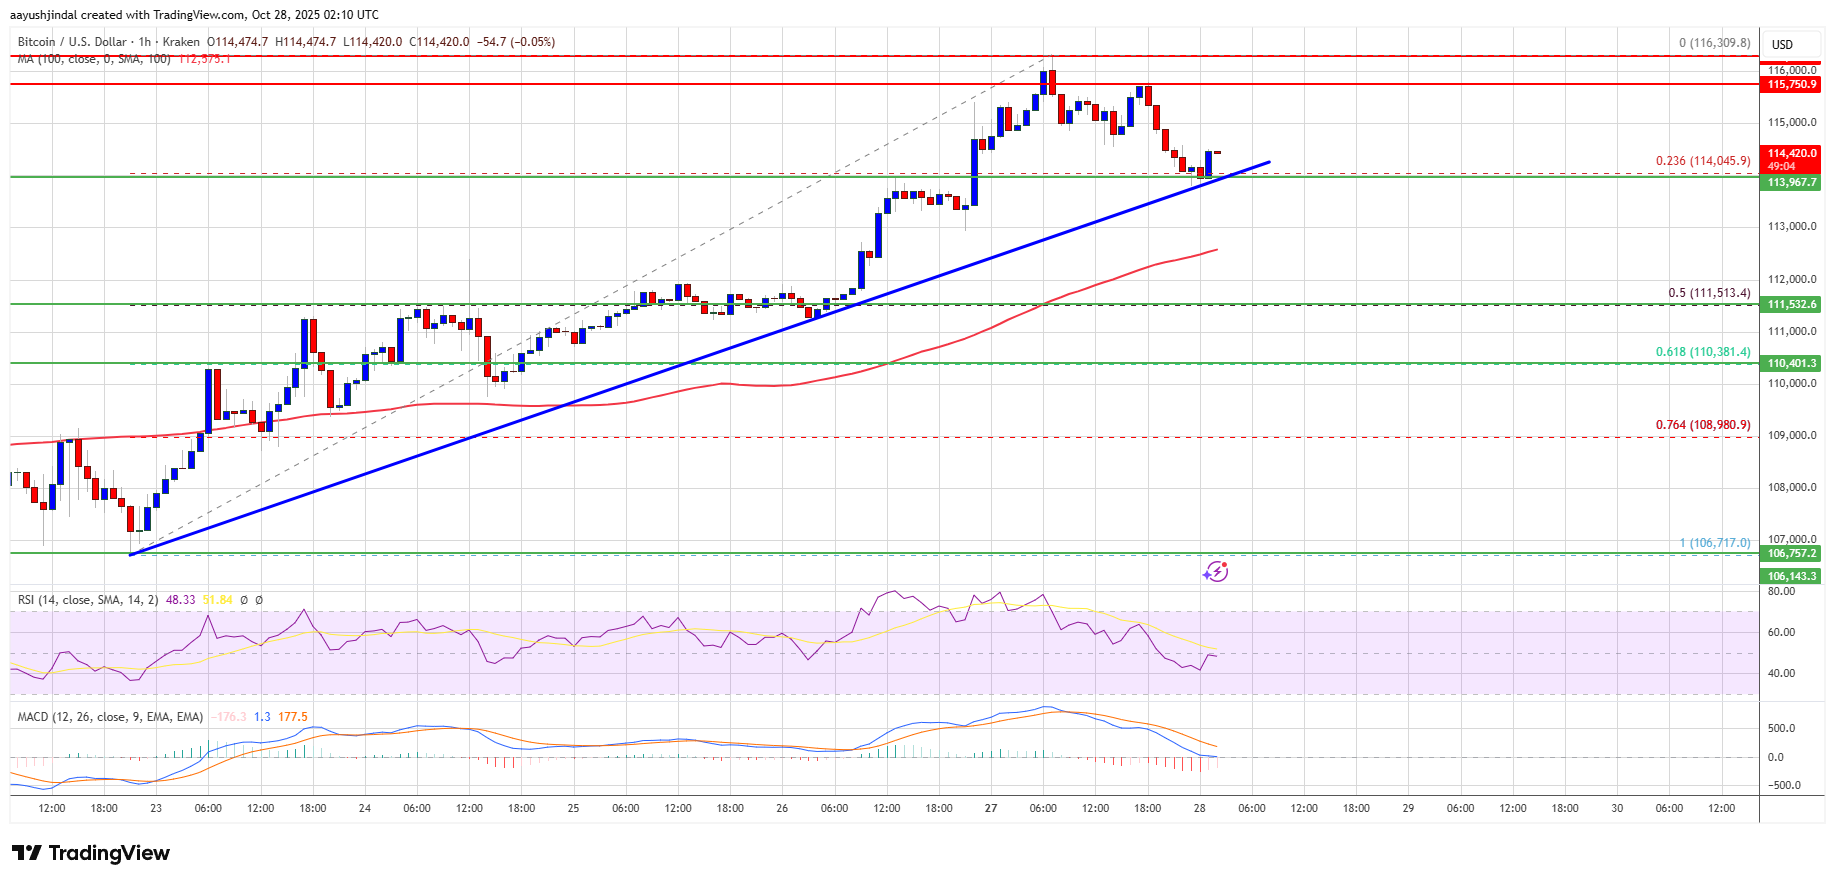
- The price is trading above $114,200 and the 100-hour simple moving average.
- On the hourly chart of the BTC/USD pair, a bullish trend line is forming with support at $113,900 (data feed from Kraken).
- If it trades above the $115,750 zone, the pair is likely to continue higher.
Bitcoin price consolidation begins
Bitcoin price has formed a base and started a new rally above the $112,500 zone. BTC gained pace on a move above the major hurdle of $113,500.
This opened the door to a price move of over $115,000 and a 100-hour simple moving average. Finally, the price soared above $116,000 and is currently consolidating gains above the 23.6% Fib retracement level of the recent wave, from a low of $106,718 to a high of $116,309.
Furthermore, on the hourly chart of the BTC/USD pair, a bullish trend line has formed with support at $113,900. Bitcoin is currently trading above $114,000 and its 100-hour simple moving average.
Immediate upside resistance is near the $115,000 level. The first major resistance level is near the $115,500 level. The next resistance level could be at $115,750. If the price closes above the $115,750 resistance level, the price could move higher. In the above case, the price may rise and test the $116,300 resistance level. Further upside could push the price closer to the $117,500 level. The next barrier for the bulls could be $118,000.
Will BTC fall again?
If Bitcoin fails to rise above the $115,500 resistance zone, a new decline could begin. Immediate support is near the $114,000 level. The first major support is near the $113,500 level or trendline.
The next support is currently located near the $111,000 zone. Any further losses could send the price towards the $110,500 support in the near term. The main support lies at $108,500, below which BTC may struggle to recover in the short term.
Technical indicators:
Hourly MACD – The MACD is currently pacing in the bullish zone.
Hourly RSI (Relative Strength Index) – BTC/USD’s RSI is currently above the 50 level.
Major support levels – $114,000, followed by $113,500.
Key resistance levels – $115,500 and $116,500.