

Traditional stocks like the S&P 500 are making a historic comeback, shaking off weeks of geopolitical uncertainty and hitting new all-time highs.
But Bitcoin, which has historically benefited from risk-on sentiment, has been significantly limp, leaving investors wondering what’s missing from Bitcoin’s story.
The S&P 500 closed the week up 0.8%, pushing the benchmark index to an all-time high of 7,022.95, surpassing its previous high set in late January.
The milestone marks a dramatic reversal from a tumultuous first quarter, when the index plunged nearly 10% to a local low of 6,316.91 on March 30 amid the US-Israel-Iran conflict and subsequent oil price shock.
While Wall Street celebrates a return to greed and big-cap tech stocks regain market dominance, Bitcoin remains in a prolonged decline.
Leading cryptocurrencies continue to trade well below their all-time highs, highlighting a rare and persistent decoupling from traditional risk assets that has not been observed to this extent since 2020.
“Momentum” that stimulates stock prices
The speed of the stock market recovery has caught many institutional desks off guard.
In the two weeks since the late March lows, the market has rapidly adapted to continued geopolitical uncertainty in the Middle East, increasing market capitalization by more than $6 trillion.
According to Warren Paiz, founder of 3F Research, the market trajectory over the past 10 days represents a statistical anomaly. The S&P 500 index is up nearly 10% and ranks in the 99.7th percentile of overall 10-day returns.
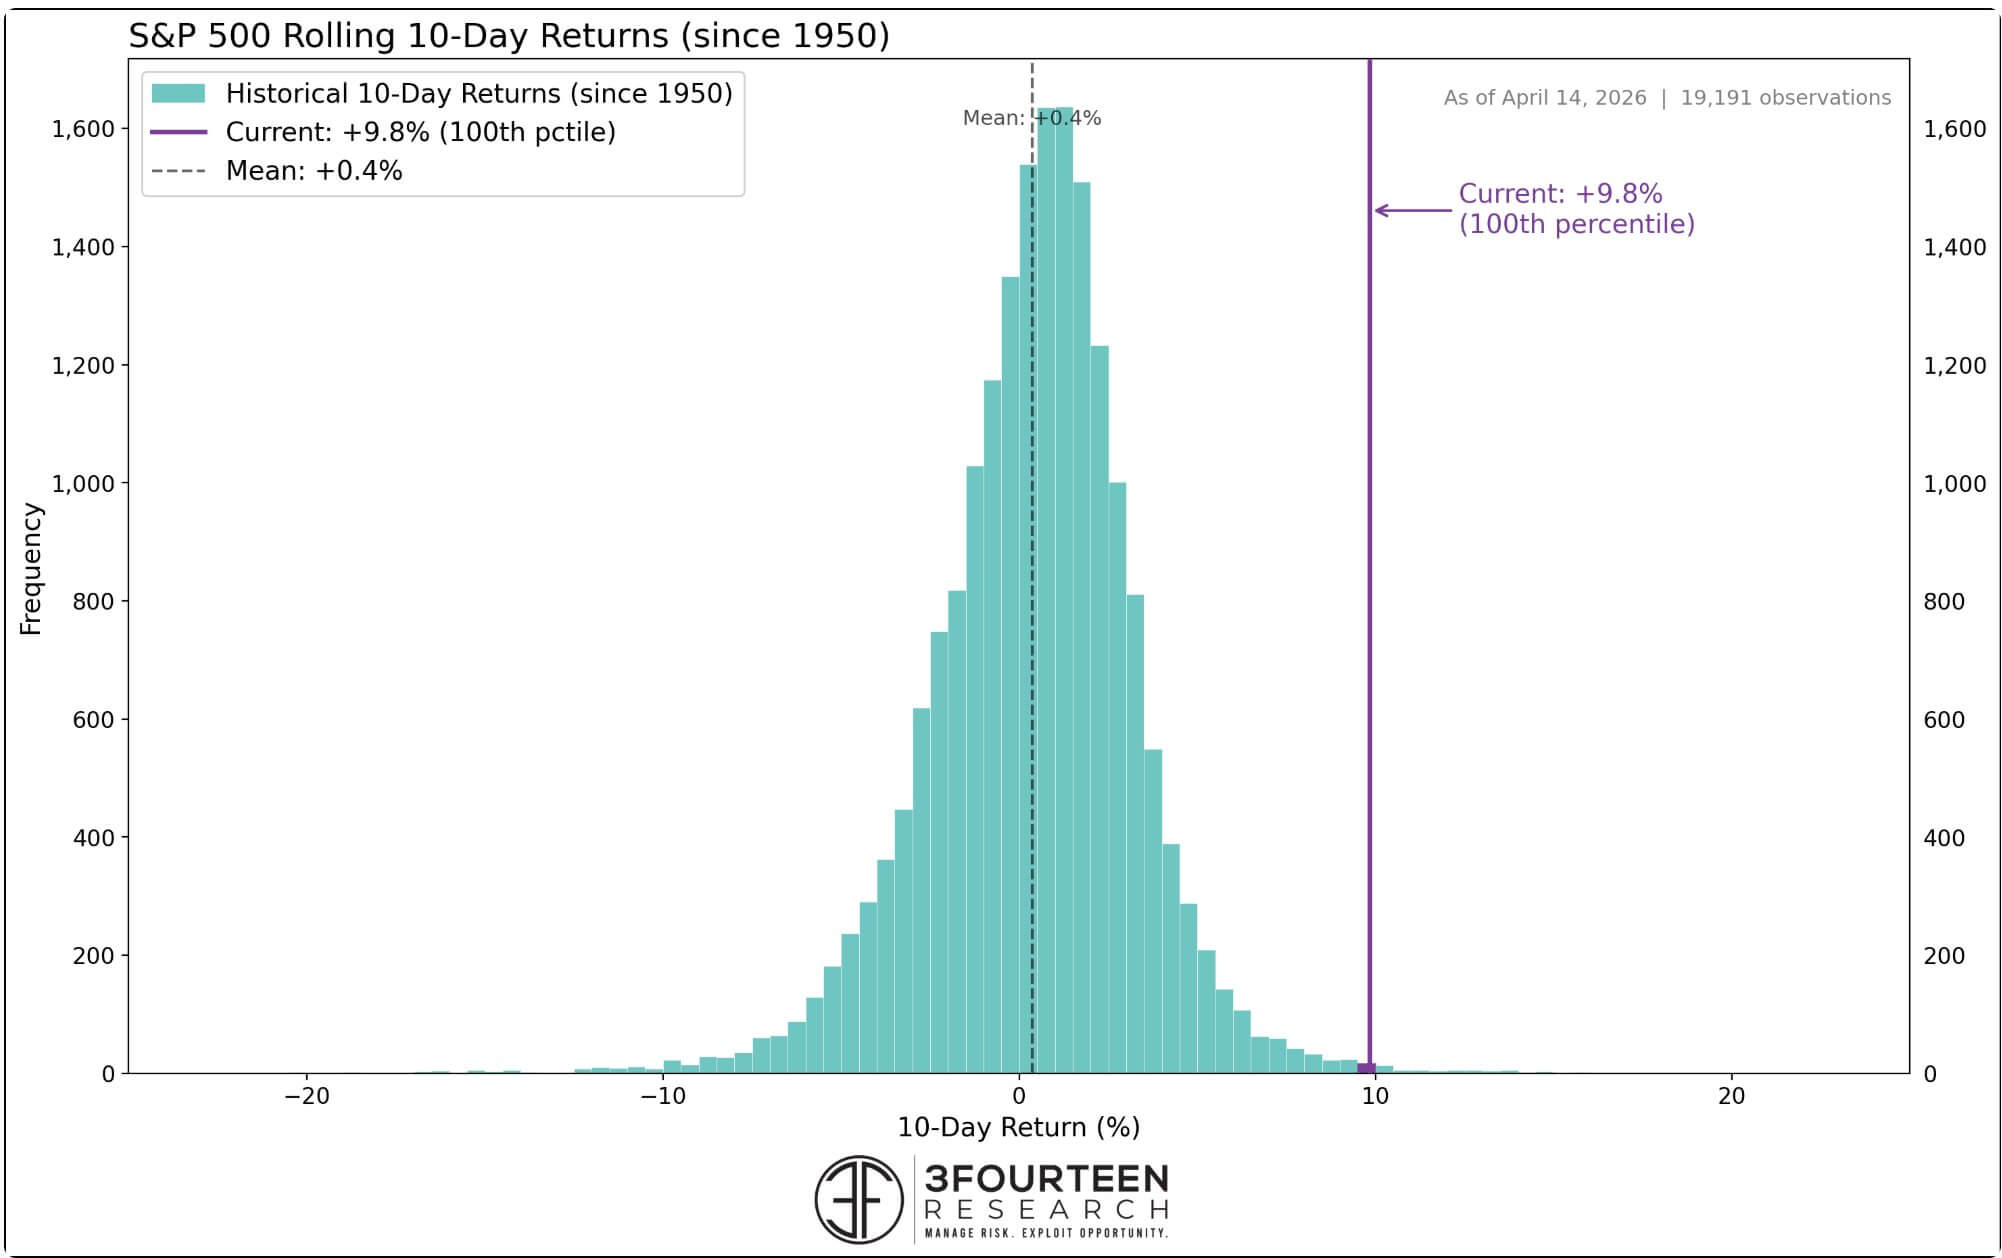
Historically, there have been only 20 times since 1950 that the stock market has recorded such a large rally in a short period of time. Pai characterizes these events as bullish “momentum pushes,” typically resulting in an average return of 19% over the next 12 months.

But what makes the current stock rally unique is that it’s nearing all-time highs.
Pais said the momentum boost so far has occurred almost exclusively during deep bear markets, with the index still languishing more than 20% below its peak.
On the other hand, the current market recovery is clearly top-class. Since the March 30 low, the Magnificent 7’s fund covering megacap technology stocks has gained nearly 18%, outperforming the broader S&P 500 index, which excludes these seven companies, by about 8%.
This aggressive institutional buying is largely driven by the “AI infrastructure” narrative, with sector leaders like Oracle becoming the main drivers of global productivity growth.
Furthermore, the macroeconomic backdrop is also providing strong tailwinds.
The easing of tensions in the Persian Gulf, highlighted by diplomatic negotiations and a temporary ceasefire, has alleviated immediate concerns about a prolonged blockade of the Strait of Hormuz.
At the same time, U.S. producer price index (PPI) data for March was well below expectations of 0.1%, showing that the U.S. economy remains highly resilient and largely insulated from the temporary energy-driven inflation spike that capped market gains earlier in the year.
Historical decoupling of the virtual currency market
While the Nasdaq Composite simultaneously achieved its longest 10-day winning streak since late 2021, the digital asset sector has failed to reflect this unbridled optimism.
Despite easing macroeconomic pressures, Bitcoin remains heavily discounted, hovering in the $74,000 to $76,000 range.
This represents a staggering 40% drawdown from its all-time high of over $126,000 and reflects months of weakness.
Data compiled by CryptoQuant highlights this disparity. According to the company, Bitcoin has traditionally been managed as a high-beta asset that moderately follows the liquidity trends of the S&P 500 and Nasdaq.
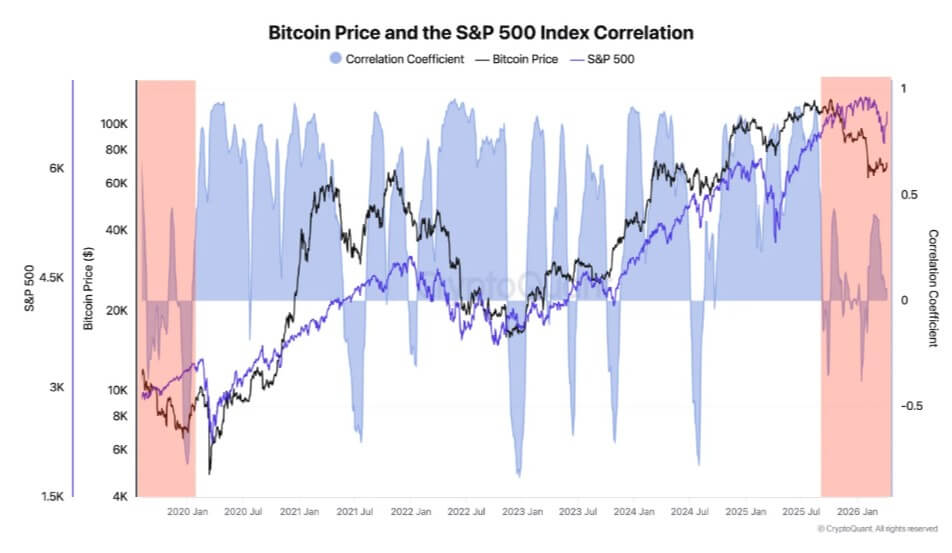
However, current price performance is driven by the company’s weak internal dynamics. As a result, the current period of weak correlation with the S&P 500 is the longest in four years.
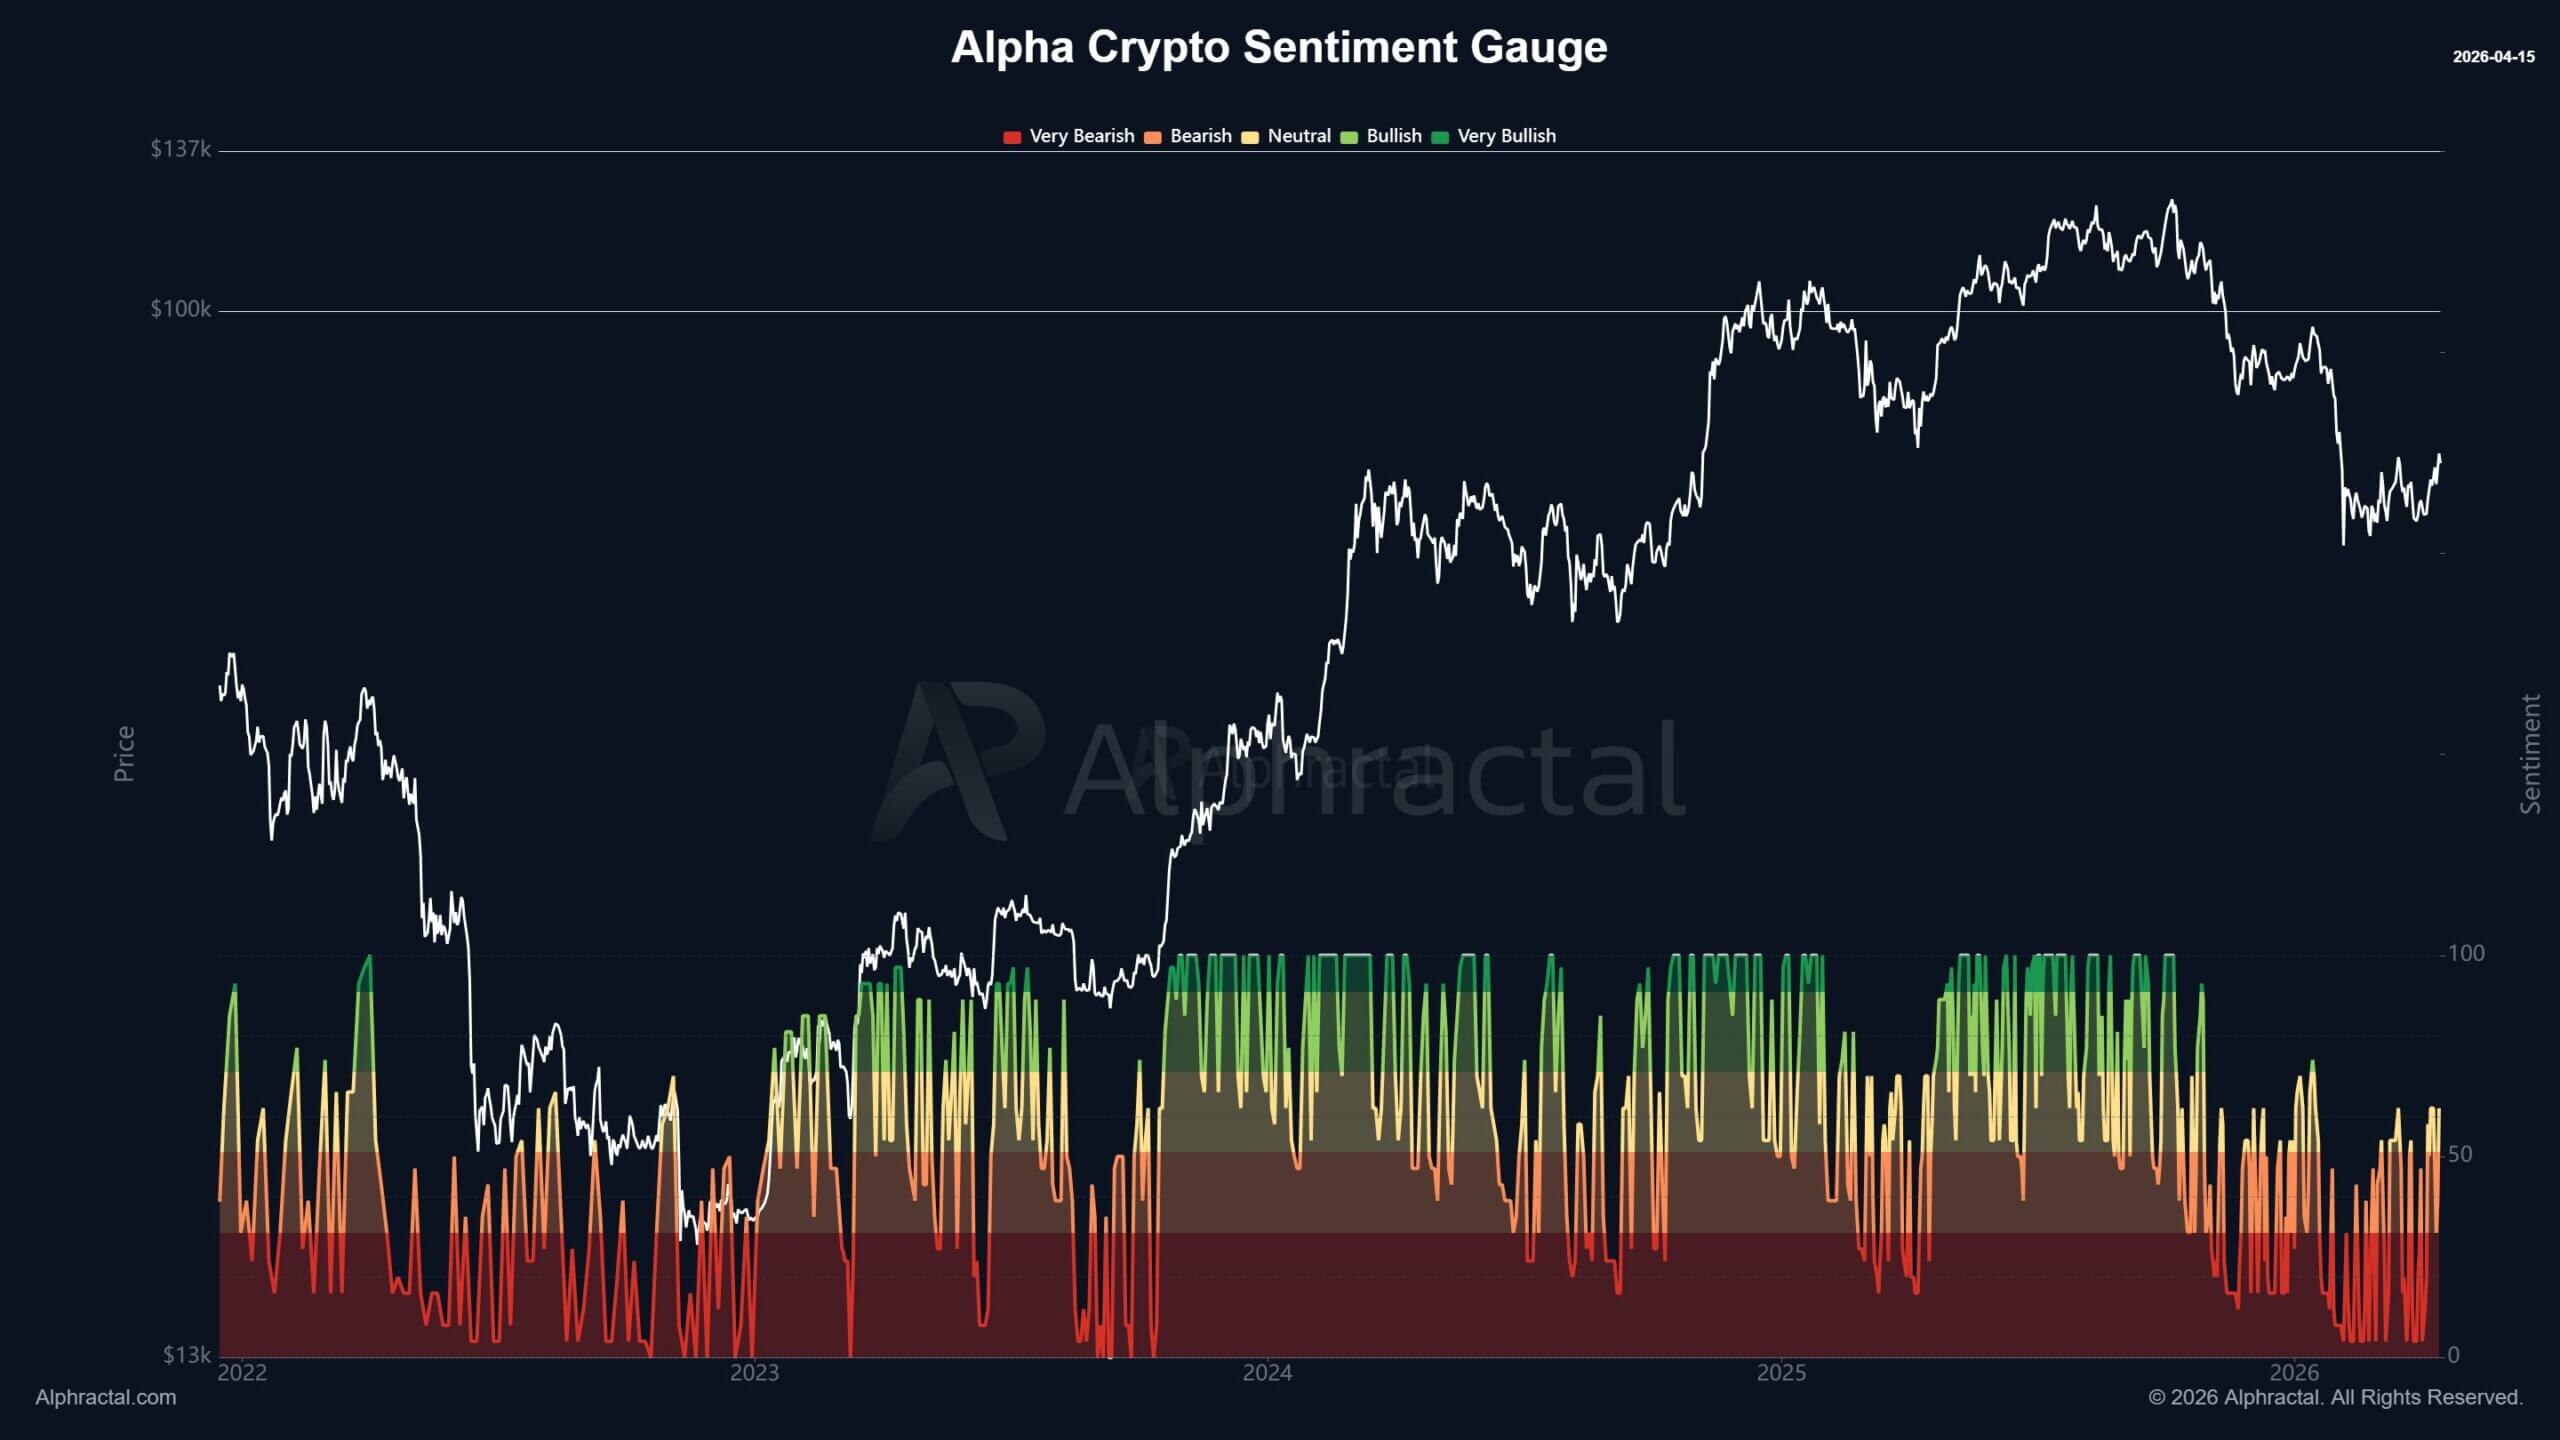
This is evidenced by the fact that sentiment across the digital asset space has moved into a “complacent stage”.
The overall crypto market sentiment is on the borderline of neutral bullish, according to analysis firm AlphaRactal, which is highly unusual given the asset’s large distance from price discovery.
On-chain indicators show fragile recovery
Internal on-chain data reveals exactly why Bitcoin is struggling to break out: a severe lack of sustained capital inflows.
CryptoQuant analyst Alex Adler pointed to changes in the 30-day realization cap, a metric that tracks net capital inflows into the Bitcoin network.
The indicator has been flashing warning signs since mid-January. Out of the first 105 days of 2026, only seven days recorded a positive change in the 30-day realized cap. Since January 23, capital has systematically flowed out of the network, culminating in a highly localized flow in late February.
Adler says:
“Since mid-January, capital has been systematically drained from the network without meeting compensation demands.”
Outflow pressures have slowed in recent weeks, improving from the deep deficit at the beginning of the month to -0.32%, but a true macroeconomic reversal has yet to occur.
For Bitcoin to mount a credible attack towards all-time highs, Adler argues, it would need to move into positive territory with a realization ceiling lasting several weeks, with price increases above the cost basis of major short-term holders.
However, there are preliminary signs of structural repair. Bitcoin is currently testing a correction realized price of around $72,300. This indicator represents the average break-even level for a large group of active investors.
Recovering and maintaining this cost standard is traditionally a prerequisite for a sustained bullish trend and serves as an important psychological support level that encourages investors to hold rather than capitulate during pullbacks.
Institutional position and future direction
Despite the lack of a definitive breakout, the institutional footprint in the cryptocurrency market is still very prominent.
Rachel Lucas, a crypto analyst at BTC Markets, highlighted that Bitcoin’s recent push towards a 70-day high of $76,000 was largely supported by $411.5 million in spot ETF inflows, the second-largest single-day on record in April.
Additionally, options markets reflect subtle changes in risk appetite. According to Brock-Scholes, the strong bias towards put contracts (downside protection) in the Bitcoin options market is starting to ease due to the tense situation in the Middle East.
However, this easing of downside concerns has not directly led to active spot buying.
Glassnode data shows demand for spot and ETFs is improving, but the market is characterized by quick profit taking and cautious option positioning.
The company says the current recovery is very “volatile” and flow-driven, lacking the deep-seated conviction found in traditional stocks.
Considering this, market structure analysts at Bitunix say: crypto slate Bitcoin currently serves as a real-time test of the market due to its ability to absorb risk.
The asset faces a formidable supply zone and clear resistance near $75,500, with a dense cluster of leveraged liquidations piling up just above $76,000.
For now, the $70,000 level remains a key support floor that institutional investors are actively defending.
If Bitcoin can convincingly clear the $76,000 resistance, it could trigger a cascading short squeeze, forcing an end to the asset’s historic decoupling and realigning it with a broader record-setting Wall Street supercycle.
Lucas explained:
“A sustained breakout above USD 76,000 would lead to meaningful structural changes and pave the way for the USD 80,000 handle.”
Until then, the crypto market will maintain a tense holding pattern, awaiting the necessary capital inflows to validate a new bullish phase.
(Tag translation) Bitcoin