


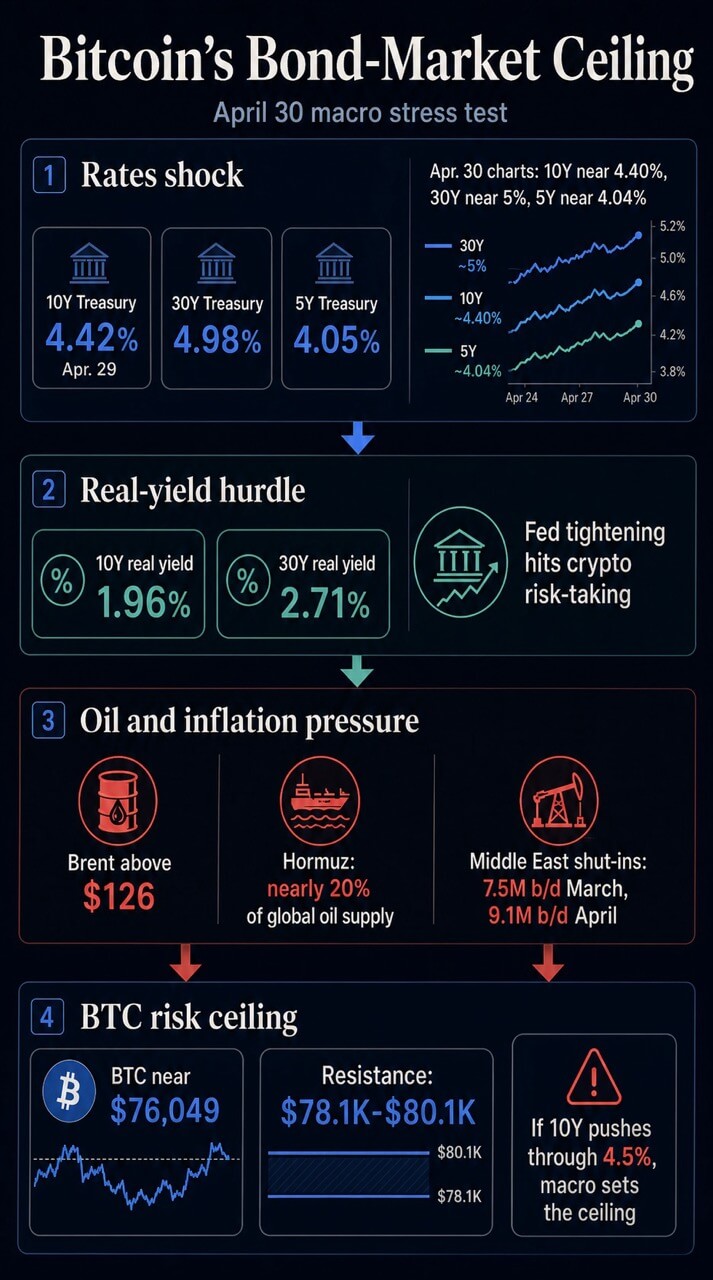
Bitcoin’s April rally is currently facing macro challenges on two fronts. The official U.S. Treasury curve as of April 29 shows the 10-year yield at 4.42%, the 30-year yield at 4.98%, and the 5-year yield at 4.05%.
Currently, the market chart shows the same pressure zones, with 10-years near 4.40%, 30-years near 5%, and 5-years near 4.04%, with WTI crude oil rising.
At the same time, Brent crude oil is trading above $126, its highest since 2022, following new reports that President Donald Trump intends to maintain a blockade of Iran for months.
Bitcoin is currently trading around $76,049, about 40% below its October 2025 high. The broader cryptocurrency market is worth nearly $2.54 trillion, with Bitcoin’s dominance at nearly 59.9%.
These levels expose Bitcoin to different kinds of tests. The crucial question is whether interest rate markets are raising the price of risk-taking faster than demand for cryptocurrencies can absorb the risk.
If the 10-year yield moves towards or above 4.5%, Bitcoin’s near-term ceiling could be set by oil, Treasury supplies, real yields, and Fed liquidity manipulation before being set by crypto-specific flows.
The market question is a direct one: If bonds continue to sell, will Washington need to reduce geopolitical oil pressures or ease the Treasury and Fed plumbing before Bitcoin regains its risk appetite?
Bond yields set the front line
The first pressure point is the nominal Treasury curve. The 10-year Treasury yield of around 4.4% is already close to the level that igcurrencynews highlighted in its recent Bitcoin bond market analysis as an area where the $80,000 test becomes more difficult.

In our April 28 analysis, we argued that a fresh inflow streak could turn into another failed rally at the resistance level if we move above 4.35% and head towards the 4.6% upside area.
The official April 29 curve puts that risk within reach. The 10-year yield was 4.42%, the 30-year yield was 4.98%, and the 5-year yield was 4.05%.
The long end is the part of the curve that most directly represents duration risk, equity multiples, mortgage pressure, and the discount rate that investors apply to assets with remote or uncertain cash flows.
Bitcoin has no coupons, dividends, or revenue streams. This means the company’s macro case is highly dependent on liquidity, risk appetite, scarcity demand, ETF access, and balance sheet demand.
As government bond yields rise, these inputs will face tougher comparisons. While Bitcoin is still below its year-to-date high, investors can earn nearly 5% on the long end of the US risk-free curve.
The real yield layer makes the setup sharper. According to the real curve for U.S. Treasuries as of April 29, the real yield on 10-year bonds is 1.96% and the real yield on 30-year bonds is 2.71%.
The Ministry of Finance publishes those interest rates as market data. The meaning of Bitcoin comes from the way BTC is traded in this regime.
An IMF study on the crypto cycle and US monetary policy found that common crypto factors explain 80% of crypto price fluctuations, and that Fed tightening reduces that factor through the risk-taking channel.
igcurrencynews also argued that Bitcoin’s recent macro identity is more like a liquidity-sensitive technology beta than a clean gold or dollar hedge.
In this regime, rising real yields could act as a disincentive to pay for market volatility. BTC can still rise, but we need stronger evidence that there is enough demand to survive higher hurdle rates.
Oil is a factor in interest rate fluctuations
The second pressure point is the oil. The United States is seeking international help to reopen the Strait of Hormuz as oil prices soar and the U.S. blockade on Iranian oil exports remains part of a pressure campaign amid stalled negotiations, Reuters reports.
Then, after President Trump warned that the lockdown could last for months, the Guardian reported that Brent had climbed above $126.
That takes the issue beyond a foreign policy risk. Oil is now part of the interest rate equation because energy prices feed into inflation expectations, headline inflation, freight rates, input costs, consumer pressures, and the Fed’s reaction function.
The Energy Information Administration’s April outlook shows the scale. The report said the Strait of Hormuz has been effectively closed to shipping since February 28, and that nearly 20% of the world’s oil supplies normally pass through the strait.
Brent prices had already reached nearly $128 on April 2nd. EIA expected Brent prices to average $115 in the second quarter, based on assumptions that include de-escalation since April.
Another EIA announcement estimated that Middle East producers shut down 7.5 million barrels per day in March, rising to 9.1 million barrels per day in April.
The forecast already treated the disruption as a major energy market event. The latest developments in the months-long lockdown call into question the duration assumptions underlying that base case.
The Fed has already connected the dots. In an April 29 statement, it said inflation was rising, due in part to rising global energy prices, and the situation in the Middle East was creating high uncertainty.
Chairman Jerome Powell’s opening statement went further, pointing out that PCE estimates for March showed headline inflation at 3.5% and core PCE at 3.2%, with headline inflation pushed up by global oil prices.
The voting results showed that the Fed’s constraints are both internal and external. The FOMC kept its target range unchanged at 3.50-3.75%.
Stephen Millan opposed it in favor of a 25 basis point cut. Beth Hammack, Neil Kashkari, and Rory Logan supported leaving the bill unchanged, but opposed leaving the mitigation bias language in the statement.
This split is the interest rate market version of the oil shock. One side had enough downside risk to favor a rate cut. The other side believed there was enough inflation risk to resist accommodative language. Bitcoin is downstream from that disagreement.
Policy measures start with plumbing work
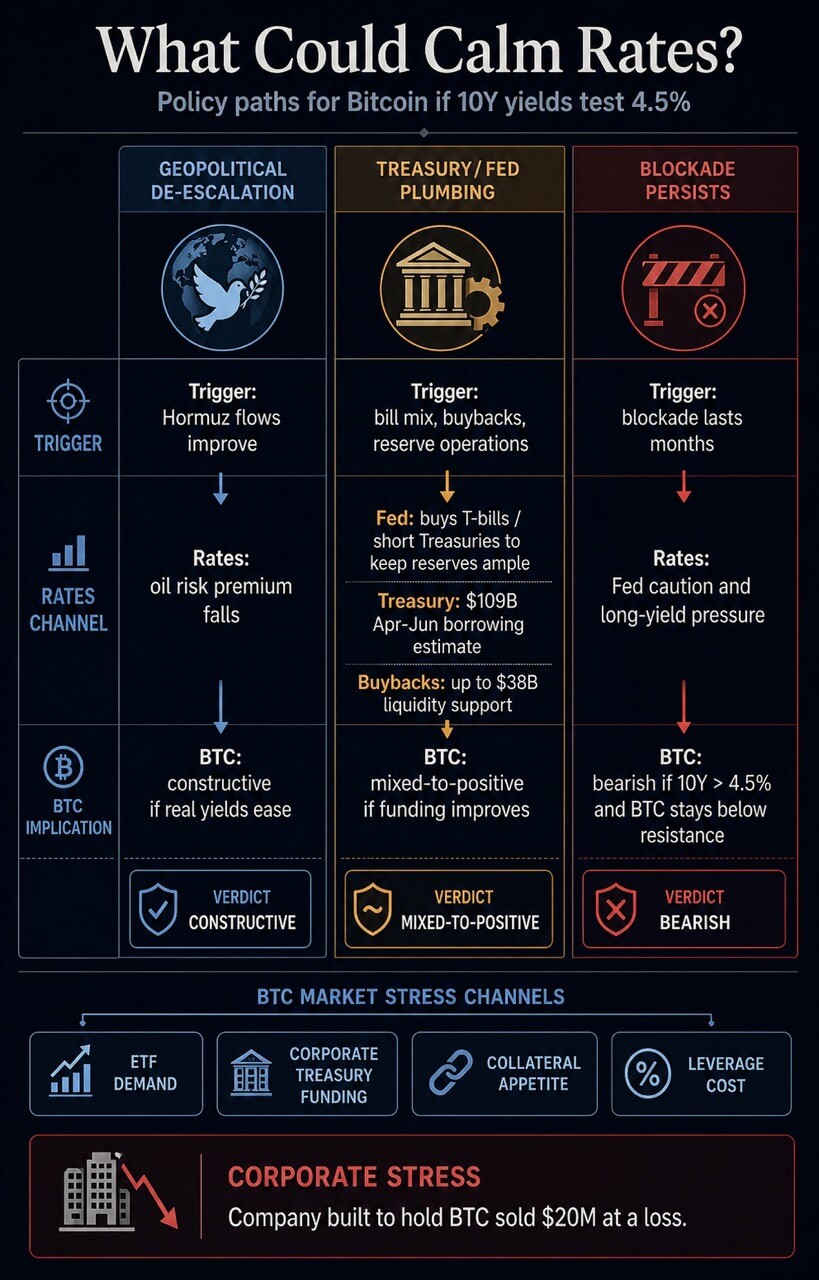
If yields continue to rise, Washington has only a few short-term channels to relieve pressure. One is geopolitical. Mitigating the oil shock by changing blockade calculations or rerouting Gulf energy flows.
This channel is the cleanest for risk assets because it directly attacks the inflationary impulse.
Another channel is liquidity management. The Fed’s implementation document maintained a managed interest rate structure and directed the open market desk to purchase Treasury bills and, as appropriate, other Treasury securities with remaining maturities of three years or less to maintain an adequate level of reserves.
That is a reservation management tool. It can support market functioning and bank reserve conditions while keeping oil prices and term premiums outside the direct toolset.
The Treasury has its own instruments. Its latest refund page shows the next major funding documents scheduled for May 4th and May 6th.
February’s borrowing estimates projected undisclosed net market borrowings from April to June to be $109 billion and cash balances at the end of June to be $900 billion.
The February rebate statement said the Treasury may adjust the size of the note, expects the Treasury General Account to peak at about $1.25 trillion in late April, and plans up to $38 billion in liquidity support and up to $75 billion in stock buybacks in one-month to two-year buckets for cash management.
These tools can impact the plumbing market. Issuing money changes the part of the curve that absorbs supply. Share buybacks can support off-the-run liquidity.

TGA movements can increase or decrease bank reserves. The constraint is that while energy inflation still puts pressure on the Fed, debt management can ease funding pressures.
| path | trigger | price channel | Impact on BTC |
|---|---|---|---|
| geopolitical détente | Hormuz River flow improves or blockade pressure eases | Oil risk premium falls, inflation expectations cool | If Bitcoin’s real yield is easy, it is the most constructive path for Bitcoin. |
| Treasury/Fed Plumbing Relief | Building mix, share buybacks, reserve operations, and TGA changes ease funding pressures | Liquidity situation improves, but oil risks remain | If real yields decline, the mix becomes positive. It becomes weaker when interpreted as a stress response. |
| lockdown continues | Oil prices are on an upward trend and the period will be extended beyond EIA’s April assumption | Fed remains cautious, long-term yields remain under pressure | Bearish if 10-year crosses 4.5% and BTC breaks below resistance |
| Flow-driven Bitcoin rebound | Spot and ETF demand absorbs short-term holder supply | Although interest rates remain high, they continue to accelerate | BTC may recover, but durability still depends on bond subsidence |
Each path remains conditional. Geopolitical channels will directly attack oil inflation pressures. The plumbing channel needs to improve its funding conditions without making the response seem stressful.
The market still needs to prove which path is active.
There is little room in the market for Bitcoin itself.
Bitcoin’s price structure makes the macro squeeze more visible. After the Fed’s decision, BTC fell below $76,000, and Glassnode data showed short-term holders taking profits around $78,000 to $79,000.
The report notes that while buyers will need to absorb indirect supply to rally towards $84,000, a break below $68,000 would reveal a more severe correction path.
igcurrencynews’s April 28 bond market analysis shows the key battleground is around $78,100 to $80,100. That area now serves as a working confirmation zone.
A recovery will show that spot demand, ETF demand, or positioning can absorb macro shocks. If rejected, it would confirm the view that the bond market remains the cap on Bitcoin.
The broader liquidity picture supports that caution. igcurrencynews’s April 30 debt and liquidity analysis argued that US debt is growing faster than M2 and that Treasury issuance, Treasury general account, reserve balances, and bank credit conditions could mean the financial base remains tight even as broad money increases.
M2’s separate igcurrencynews analysis found that Bitcoin’s liquidity relationship is lagged and regime-dependent, with real yields, dollars, ETF flows, and geopolitical shocks potentially invalidating simple money supply arguments.
Corporate financial demands add new channels. igcurrencynews’s coverage of Bitcoin government bond trading indicated that corporate and government holders could become sellers if funding pressures increase, debt demand increases, or the value of cash becomes higher than it is from a balance sheet perspective.
A company founded to accumulate BTC sold it at a loss of $20 million, turning that risk into a concrete example.
That is why the current settings extend beyond spot traders. Rising government bond yields could put pressure on Bitcoin through discount rates, ETF demand, corporate treasury funds, collateral appetite, and leverage costs.
Oil remains subject to Fed constraints. Treasury supplies emphasize reserves and term premiums. Bitcoin’s own supply zone determines how quickly these macro forces manifest in the price.
Bitcoin can still rise from here. A strong enough flow bid can absorb profit-taking for a while, and previous crypto slate oil war coverage showed that BTC can resist intraday oil pressure if demand is present.

The problem is durability. As US stocks opened in the previous session, Bitcoin returned to a broader risk trade.
It’s still the same open test. If BTC rebounds below $80,000, it would indicate that buyers are still active. A sustained breakout of the resistance zone will require evidence that bonds, oil, and liquidity are no longer working against trade.
The next signal comes from the 10-year bond yield. A stabilization in the 4.4% to 4.5% zone would give Bitcoin’s demand story some breathing room.
If oil prices remain elevated and rise further, BTC’s ceiling is likely to remain outside of cryptocurrencies. The bond market is still deciding how much risk investors are willing to take.
(Tag translation) Bitcoin