


Bitcoin ($BTC) may be approaching a major tipping point after the historic halving signal resurfaces, increasing the risk of a sharp market correction.
According to an analysis by trading shots shared by TradingView According to a May 15 post, Bitcoin has passed 760 days since its April 2024 halving event, a period that has historically coincided with major market declines.
In previous cycles, it used to be $BTC Once the 760-day post-halving mark was reached, the asset immediately declined, ultimately leading to a broader bear market phase.
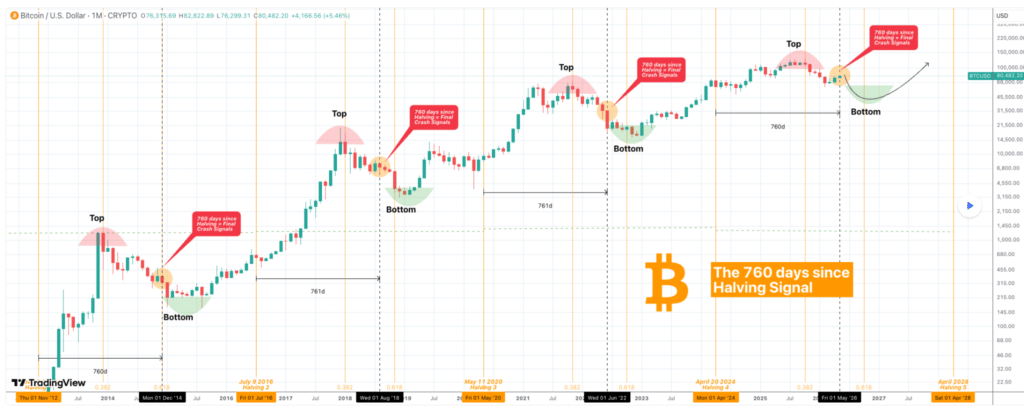
Similar patterns emerged after the halvings in 2012, 2016, and 2020, with Bitcoin forming a market top before entering a sharp correction shortly after the 760-day signal appeared.
These declines later developed into a “bottom process”, where the market established a long-term foundation before starting a new bullish cycle.
The analysis also highlighted the relationship between Bitcoin and the 0.618 Fibonacci time level between halving cycles.
Historically, the 760-day signal has appeared before this critical timing level, with the exception of 2014, when it coincided exactly with this critical timing level.
In the current cycle, the 0.618 Fibonacci level is expected to occur around October 2026, a period that could coincide with a broader bear market phase and could mark the bottom of Bitcoin’s next major cycle.
Additionally, the chart pattern suggests that Bitcoin may already be transitioning from an upside phase into the early stages of a correction, with the expected curvilinear path pointing to a possible decline before a long-term recovery begins.
Bitcoin network is growing stronger
Interestingly, this outlook comes at a time when Bitcoin’s on-chain activity is showing renewed strength, a trend that has historically coincided with the end of regional lows and the return of stronger market conditions.
Specifically, data from Glassnode vector The framework, shared on May 15th, shows that the growth of the Bitcoin network is rapidly approaching the key 60 level. This level coincided with the previously strong threshold. $BTC Rebound.
#Bitcoin network activity is recovering rapidly.
Historically, spikes in network growth above the 60 level have coincided with the end of local lows and the return of stronger market conditions.
Our Vector framework is #$BTC Now we are approaching the same inflection zone… pic.twitter.com/WZbmZsdBW0
— Glassnode (@glassnode) May 15, 2026
After falling into a “weak activity” phase during the recent correction, the indicator is currently rising sharply, indicating a recovery in user participation and transaction demand.
Similar spikes in network growth were seen near the end of bear phases in 2021, 2022, and 2024, often preceding new bullish momentum. A break above the 60 level could reinforce the view that Bitcoin has formed a local bottom and is gearing up for further upside.
Bitcoin price analysis
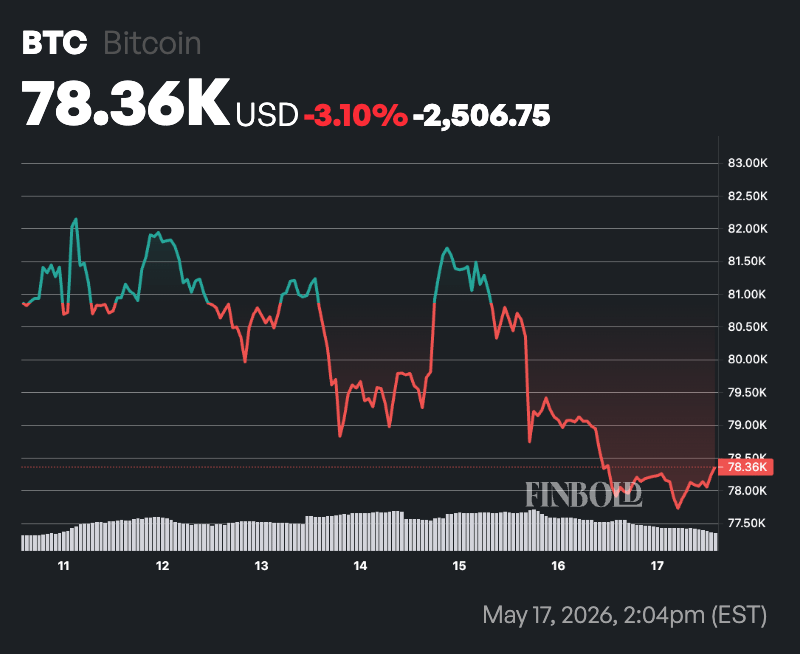
Meanwhile, the cryptocurrency has retreated from recent highs around $82,000 after undergoing a correction influenced by macroeconomic factors such as bond yields, inflation data, and geopolitical developments.
At the time of writing, Bitcoin was trading at $78,362, up about 0.5% over the past 24 hours. On the weekly chart, the asset continues to decline by more than 3%.
Analysts see $80,000 to $83,000 as the main resistance zone around the 200-day moving average (MA). A decisive break above this level could send Bitcoin towards $85,000-88,000, while stronger momentum could support a rally to $90,000-100,000 later this year.
On the downside, immediate support lies around $77,500-$78,500, and if selling pressure increases, there will be deep bottoms around $75,000 and $71,000-$73,000. Despite the recent volatility, the broader market structure remains intact as bulls continue to protect the lows.