


Bitcoin ($BTC) June is off to a great start. Within 5 days, the price fell by 14.4%. Cumulative outflows from spot exchange-traded funds (ETFs) totaled $1.399 billion in the first three days of the month.
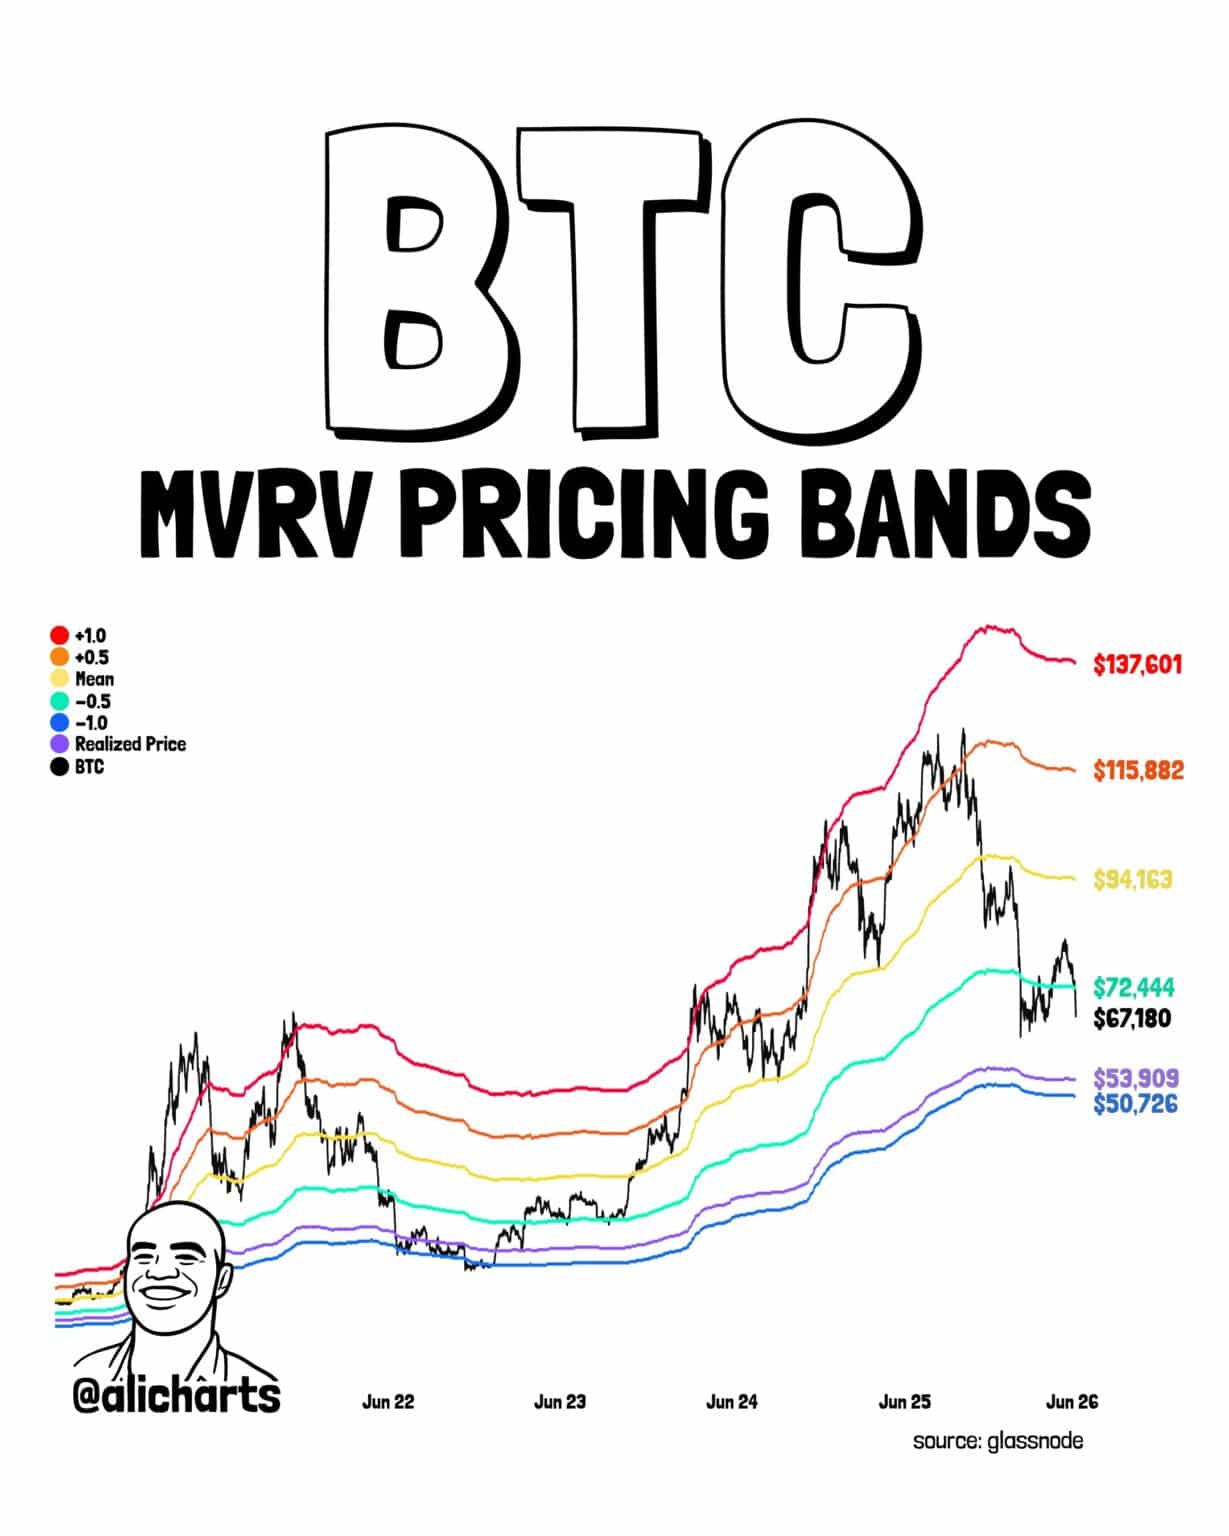
In a post on X, Ali Martinez used data from Glassnode to demonstrate that Bitcoin lost control at the $72,400 level. This level was one of the price ranges derived from the MVRV ratio. Specifically, it was -0.5σ, or half a standard deviation below the mean of $94.1k.
The next major support zones are around $54,000 and $50,000, which is in line with AMBCrypto’s recent $51,000 prediction.
Sustained pressure on Bitcoin led to large-scale liquidations. The $60,000 support level, based on the February crash lows, is about to be tested and could lead to a capitulation event.
Bitcoin rainbow chart shows darkness at peak
Altcoin Daily, a popular crypto commentary account, observed that the price of Bitcoin has fallen below the rainbow chart once again.
This tool is more of a fun chart that plots price trends using logarithmic regression than an indicator for making serious financial decisions.
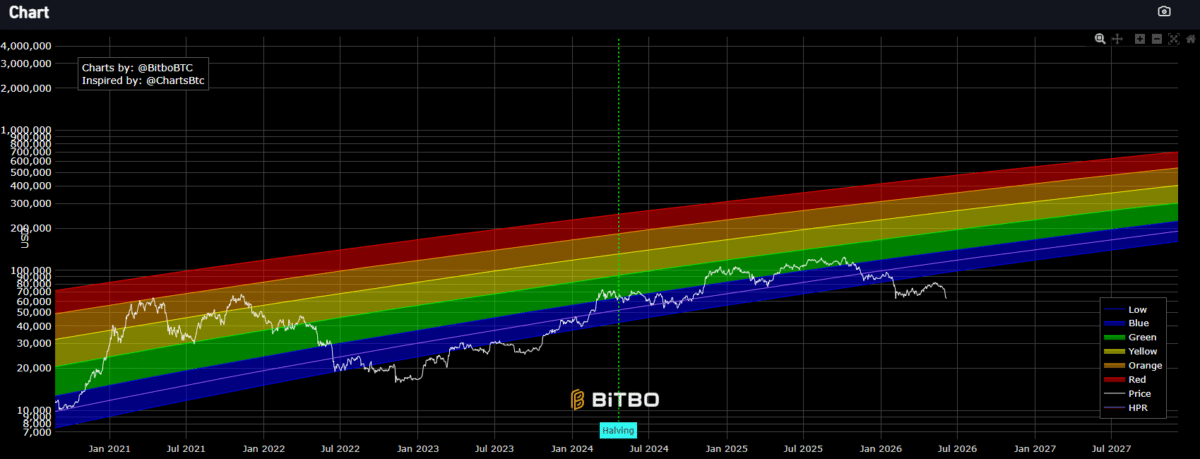
In September 2022, Bitcoin fell below the lower limit of the rainbow chart. It remained there for just over a year until the bull run resumed. Recently, according to the graph above, $BTC The rainbow disappeared in February 2026.
Please note that rainbow charts are not created with evolving cycles in mind. As cryptocurrencies and Bitcoin mature as a market, initial volatility is decreasing.
Each cycle’s peak is less extended, percentage-wise, than the previous peak.
This is to be expected as the market capitalization of assets increases. $BTC Many developments are also underway, including spot ETFs and institutional holdings. Saylor’s long-term bet included taking on more debt to finance the acquisition. $BTCeffectively making MSTR a leveraged Bitcoin ETF.
Investors need to be agile in their analysis and appreciate the Bitcoin Rainbow Chart, which is a prediction rather than an accurate predictive model.
Final summary
- Bitcoin has fallen below the lower band of the rainbow chart, just as it did during the 2022 bear market.
- On-chain indicators and market sentiment point to a potential decline towards $51,000 in the second half of 2026.