


Ethereum has fallen to multi-year lows as key on-chain profitability metrics have fallen to their lowest levels since 2017, raising new questions about whether the market has fully priced in the current bear cycle.
According to crypto.news data, Ethereum ($ETH) Price traded around $1,685 on June 8, after rebounding from recent lows around $1,505 during last week’s market-wide liquidation event. Despite having recovered, $ETH It remains one of the worst-performing major cryptocurrencies this year as investors continue to reduce their exposure to risky assets.
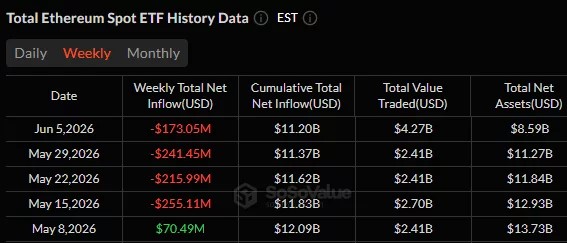
The U.S. Spot Ethereum ETF has recorded about $885 million in net outflows over the past month, according to data from SoSoValue, continuing a multi-week trend of institutional investors exiting Ethereum investment products.
The withdrawals coincided with a decline in derivatives activity, as open interest and leveraged long exposures declined sharply during the correction.
At the same time, on-chain data suggests that Ethereum holders have lost much of the profit cushion that supported the previous bull market.
According to data from Glassnode, only 11% of Ethereum’s circulating supply currently has unrealized gains of more than 300%, which is in line with levels last seen in February 2017. Unlike previous cycles, Ethereum never achieved the kind of profitability expansion seen in the 2017-18 and 2020-21 bull markets, when more than half of the network’s supply had unrealized gains of over 300%.
share of $ETH Supply, which is more than three times profit, fell to 11%, the lowest level since February 2017.
What makes this cycle structurally different?
In the previous two cycles, this cohort accounted for more than 50% of the total supply at its peak. This time, that threshold was never there… pic.twitter.com/W6TILTLH2B— Glassnode (@glassnode) June 8, 2026
Therefore, this suggests that far fewer Ethereum holders have accumulated the huge gains seen in earlier cycles, and that the majority of investors are much closer to entry prices during the recent economic downturn.
Historical bottom signal has not yet appeared
Several analysts claim that Ethereum is nearing a key inflection point due to the collapse of highly profitable supply.
According to cryptocurrency analyst Aldi, the previous Ethereum bear market reached its final low for the first time after the weekly RSI fell below the 30 level and remained there for several weeks.
“We are not yet in oversold territory and are just below $1,700. This is not a great position to be in, with key macro support only 15% below current price.”
This observation comes as Ethereum’s weekly RSI is hovering around 31, just above the oversold zone associated with both major cycle lows in 2018 and 2022.
Aldi also pointed out that the current cycle is different from previous ones, as Ethereum has never experienced the parabolic breakouts that characterized earlier bull markets. $ETH has been trading in the lower half of the RSI range for an unusually long period of time, raising the possibility that this asset does not require the same type of capitulation event seen in previous bear cycles.
Macro conditions complicate the outlook. Last week’s better-than-expected U.S. labor market data dampened expectations for the Federal Reserve’s interest rate cuts, weighing on the dollar’s strength and risk assets. Bitcoin’s fall below $60,000 triggered a wave of liquidations across crypto markets, pushing Ethereum to levels last seen in early 2023.
Key resistance remains near $1,700
Price action currently positions Ethereum at an important technology level. Looking at the daily chart, $ETH It is trading below a downtrend line that has capped gains since April.
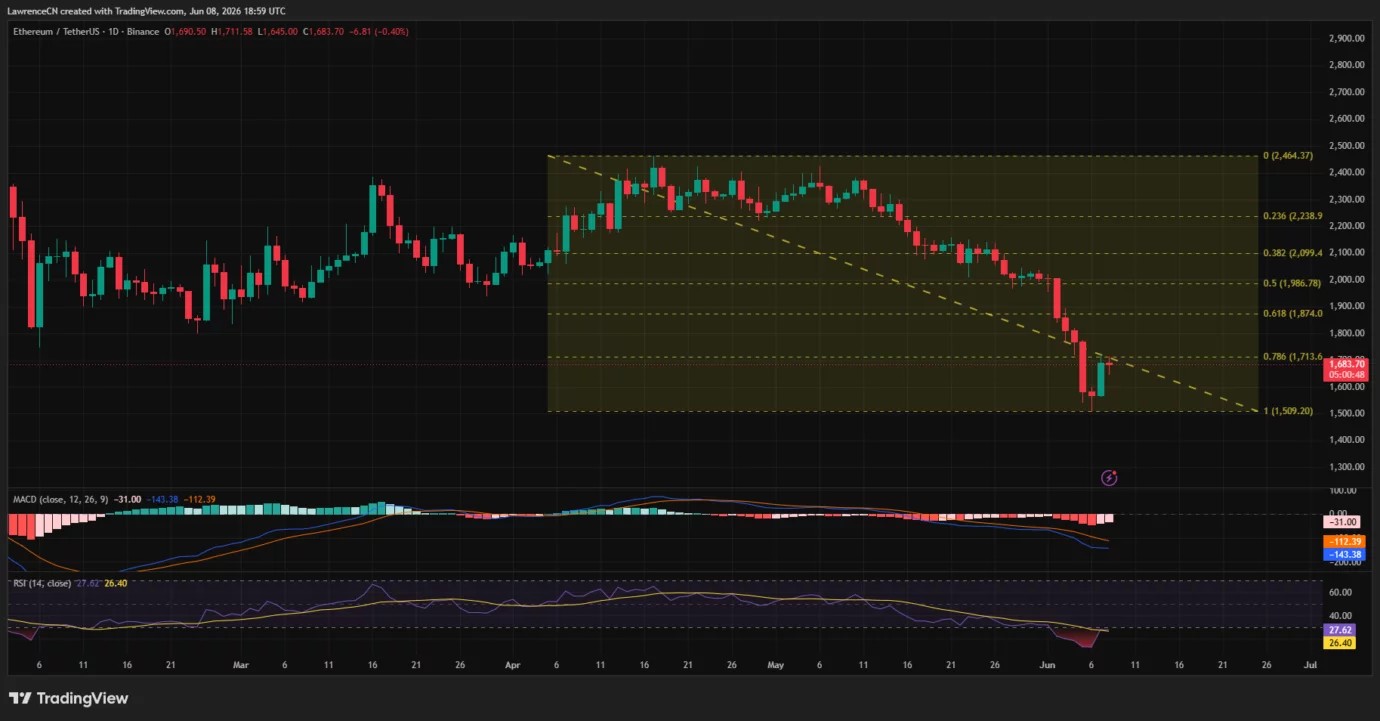
Following the rebound from the 1.0 Fibonacci retracement level near $1,509, $ETH The price is attempting to regain resistance near $1,714. A break above this level could open the door to $1,874 and $1,987.
Momentum indicators remain mixed. The daily RSI has recovered from oversold territory but remains below the neutral 50 mark, while the MACD continues to trade below its signal line despite showing early signs of stabilization.
Short-term charts show that Ethereum has formed a bearish flag after rebounding from its June 6 lows near $1,505. The recovery is unfolding within an upward-sloping channel, with price currently testing both the top of the pattern and the supertrend resistance near $1,710.
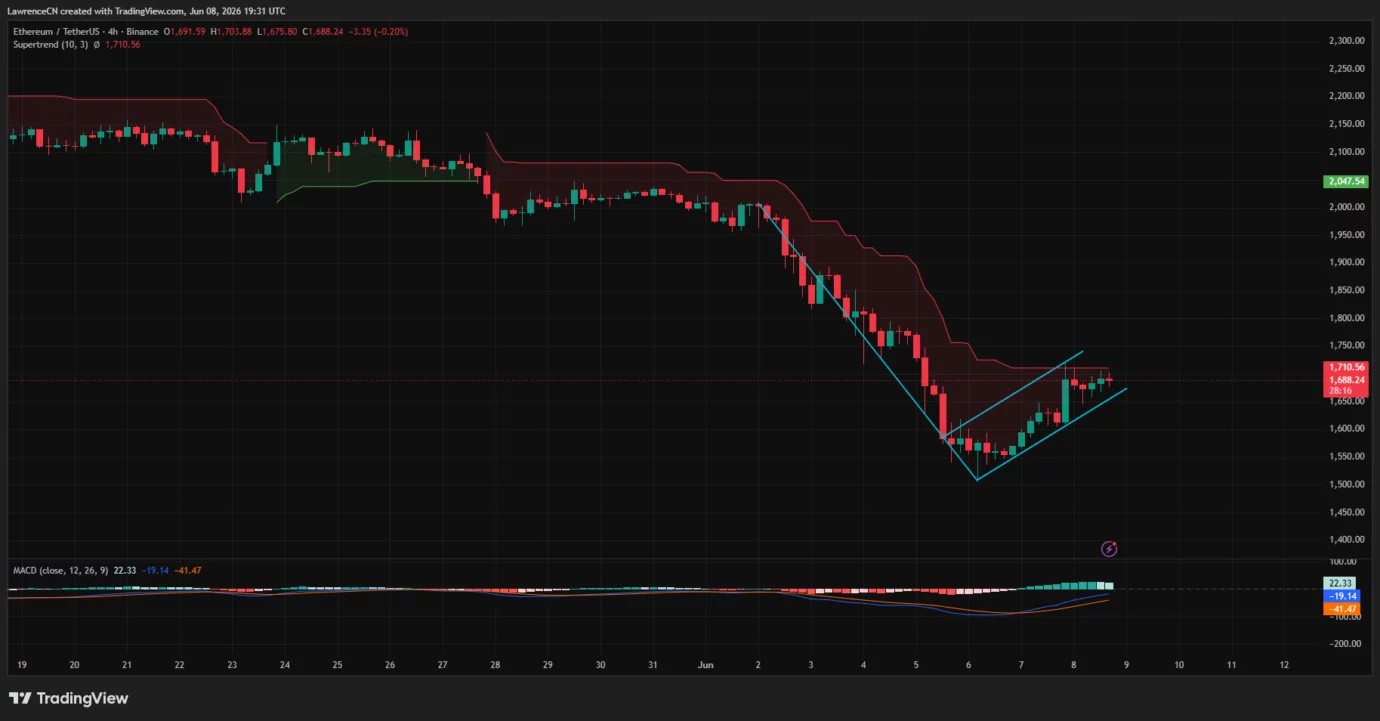
A rejection from current levels could strengthen the bearish flag structure and bring focus back to the $1,505 support area. Conversely, a move above the supertrend resistance and channel near $1,710 invalidates the bearish setup and suggests buyers are regaining control.
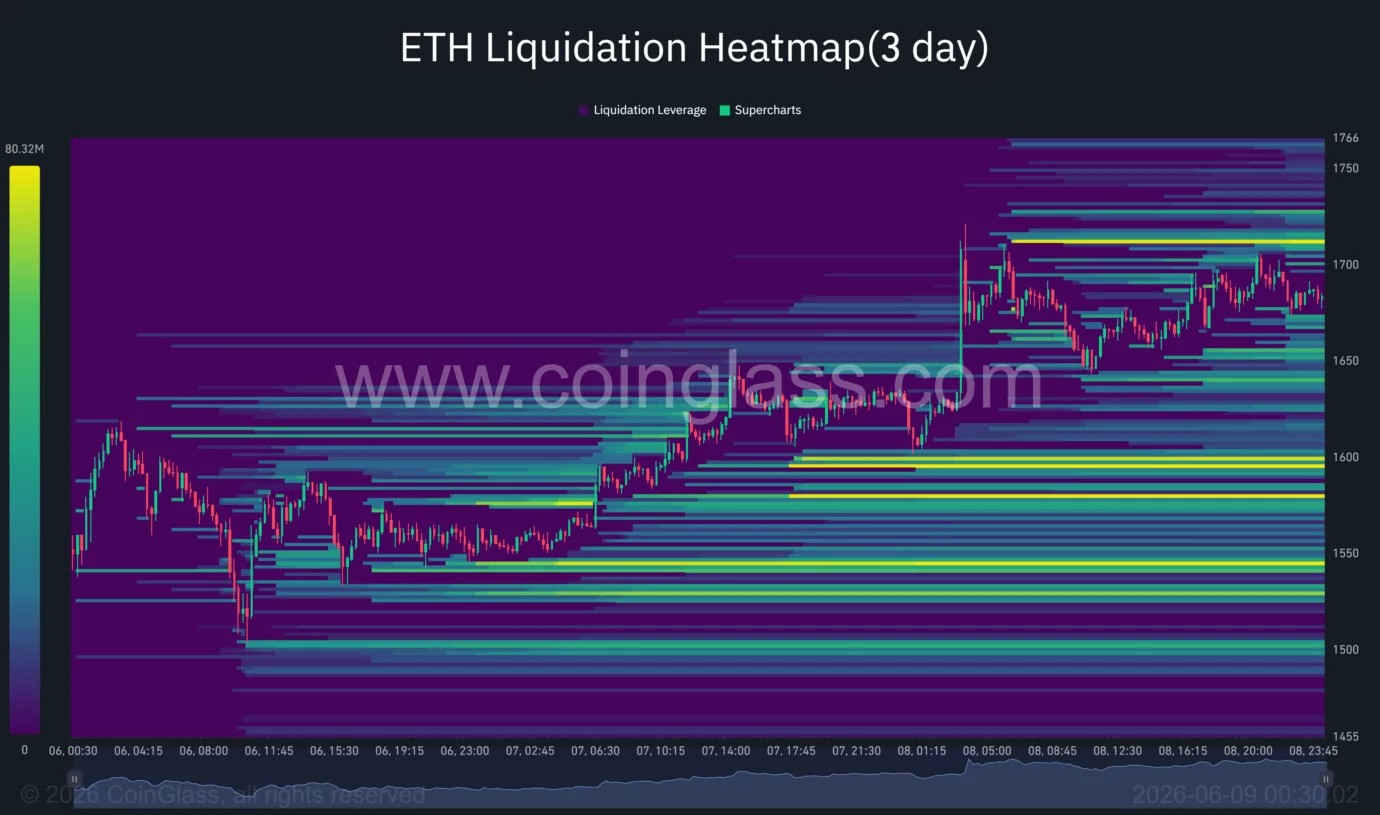
CoinGlass liquidation data shows that while there is a large cluster of short-term liquidations between $1,710 and $1,730, the significant long-term liquidation pool remains concentrated around $1,600, $1,580, and $1,540. These levels could become important liquidity targets if volatility increases.
For now, Ethereum is caught between a historically weak profitability profile and a technical structure that has not yet seen a sustained reversal. How buyers react around the $1,700 level may determine whether the latest Glassnode numbers indicate a late-term capitulation or a stop on the way down further.