


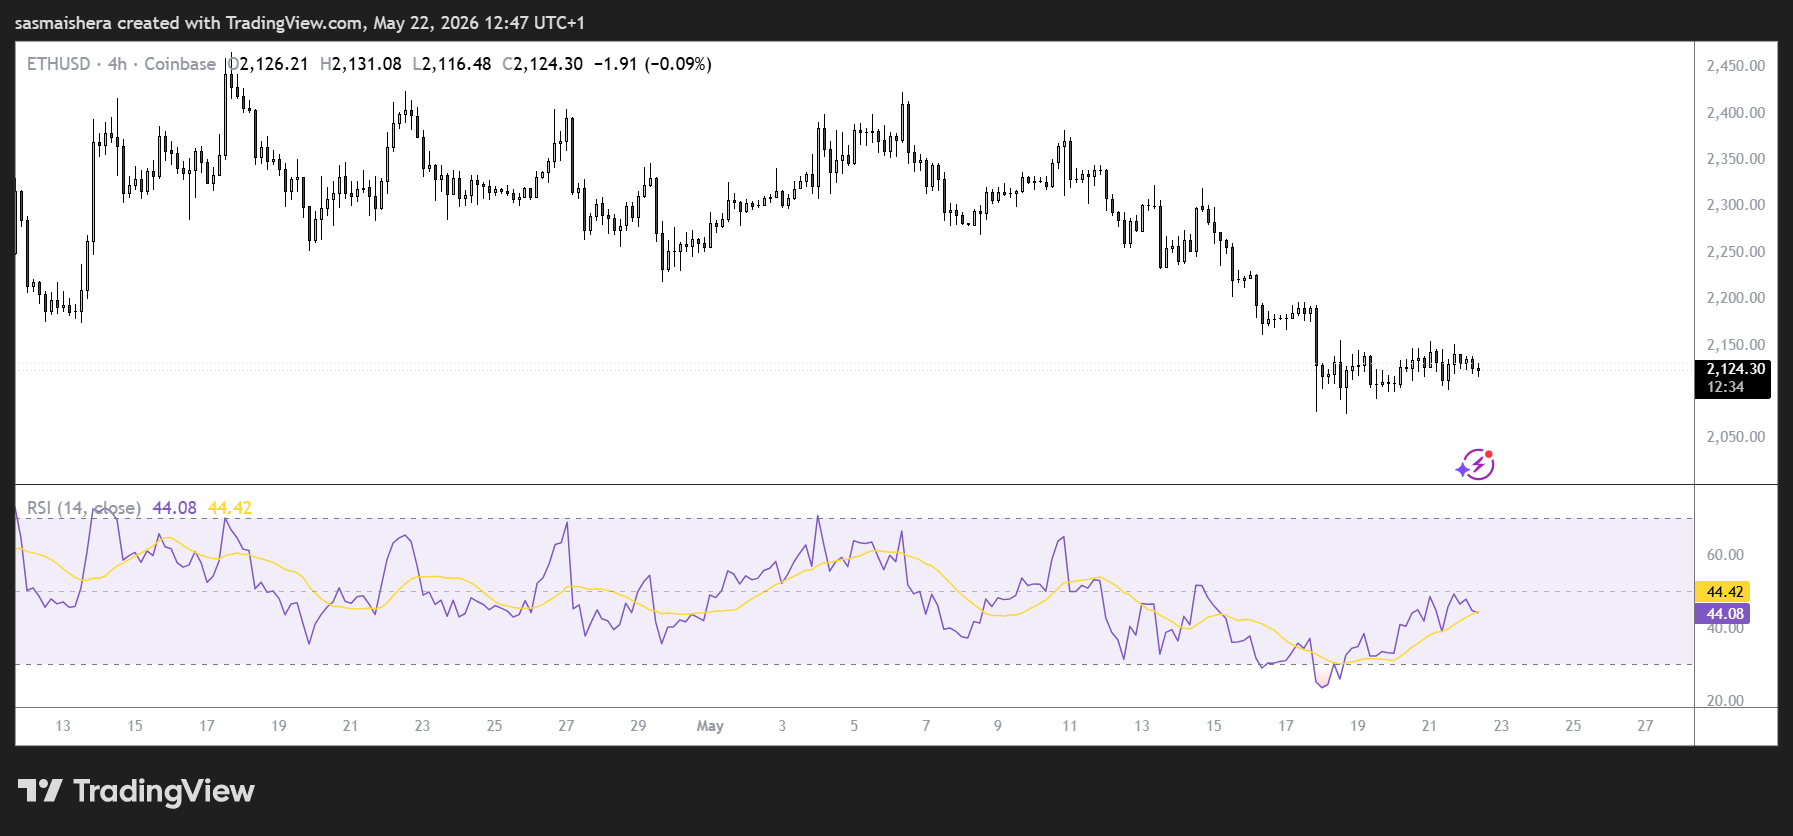
Ethereum has struggled to break above the $2,200 level in recent days and is now at risk of falling below $2,100.
Institutional and retail demand has declined in recent days, suggesting that investors lack confidence in Ethereum at the moment.
Momentum indicators are also showing a neutral picture and the $2,067 support level may apply soon.
Institutional demand continues to decline
Ethereum has been underperforming since the beginning of the week due to a decline in institutional demand.
The Ethereum exchange-traded fund (ETF) recorded $32.4 million in outflows on Thursday, extending its losing streak to nine consecutive days, according to CoinGlass’ ETF page.
The ETF has lost millions of dollars since last week, coinciding with Ethereum’s fall from the $2,225 resistance level.
Retail demand has also remained sluggish in recent days.
Ethereum futures open interest (OI) was $31.98 billion, down from $32.7 billion the previous day.
The long-to-short ratio for the past 24 hours is 0.97. When this indicator stays below 1, it means shorts are paying out longs, indicating a bearish trend.
However, the OI weighted funding rate is a positive 0.0057%.
Mixed signals in derivatives indicate indecision among traders, which could limit any recovery attempts in the near term.
Ethereum Price Prediction: Will Ethereum resume its rise?
of $ETHThe /USD 4-hour chart is bearish and efficient as Ethereum saw $24.39 million in liquidations in the past 24 hours, led by $12.76 million in short-term liquidations.
The liquidation values between long and short are close, indicating market indecision.
$ETH remains above the $2,067 support level, and recovery efforts are limited by resistance levels near the 20-day, 50-day, and 100-day exponential moving averages (EMAs).
Momentum indicators also paint a neutral picture and reflect market indecision.
The Relative Strength Index (RSI) is at 48, near a neutral 50, indicating that bearish momentum is fading.
The Moving Average Convergence Divergence (MACD) line is also in negative territory.
If the bulls finally regain control of the market, it could push the price above the first major resistance at $2,211 and then the 20-day EMA near $2,225.
If the daily candlestick closing price rises above these resistance levels, $ETH The 50-day EMA is expected to rise towards the $2,244 area and the 100-day EMA towards the $2,326 area.
The resistance level at $2,388 could pose a major challenge for bulls in the medium term.
However, if the $2,067 support level fails and Ethereum continues its decline, buyers could enter the low demand zone at $1,909 and $1,741.
The demand zones around $1,524 and $1,405 could act as strong support levels to prevent the bearish range from moving lower.
As overall crypto market performance remains weak, Ethereum may continue to consolidate below $2,200 in the short term.


