


Caught between conflicting signals, Ethereum is attempting a daily recovery even as hourly momentum declines. As of July 13, 2026, the price of Ethereum currently stands at $1,778.96. $ETH It’s right at the intersection of two conflicting technological narratives.
Important points
- $ETH will be traded at $1,778.96above the daily EMA20, but below the key $1,799-$1,800 resistance zone.
- The daily MACD is showing a bullish crossover, but the hourly chart remains under seller control.
- The Fear and Greed Index is: 28and the superiority of Bitcoin 56% Continues to weigh on altcoin performance
- Uniswap V3 fees soar 48.84% Within 24 hours, showing active relocation rather than clear accumulation
- A definitive close above $1,800 is needed to test the recovery theory. Failure risks a fall towards $1,753
How is Ethereum performing on the daily time frame?
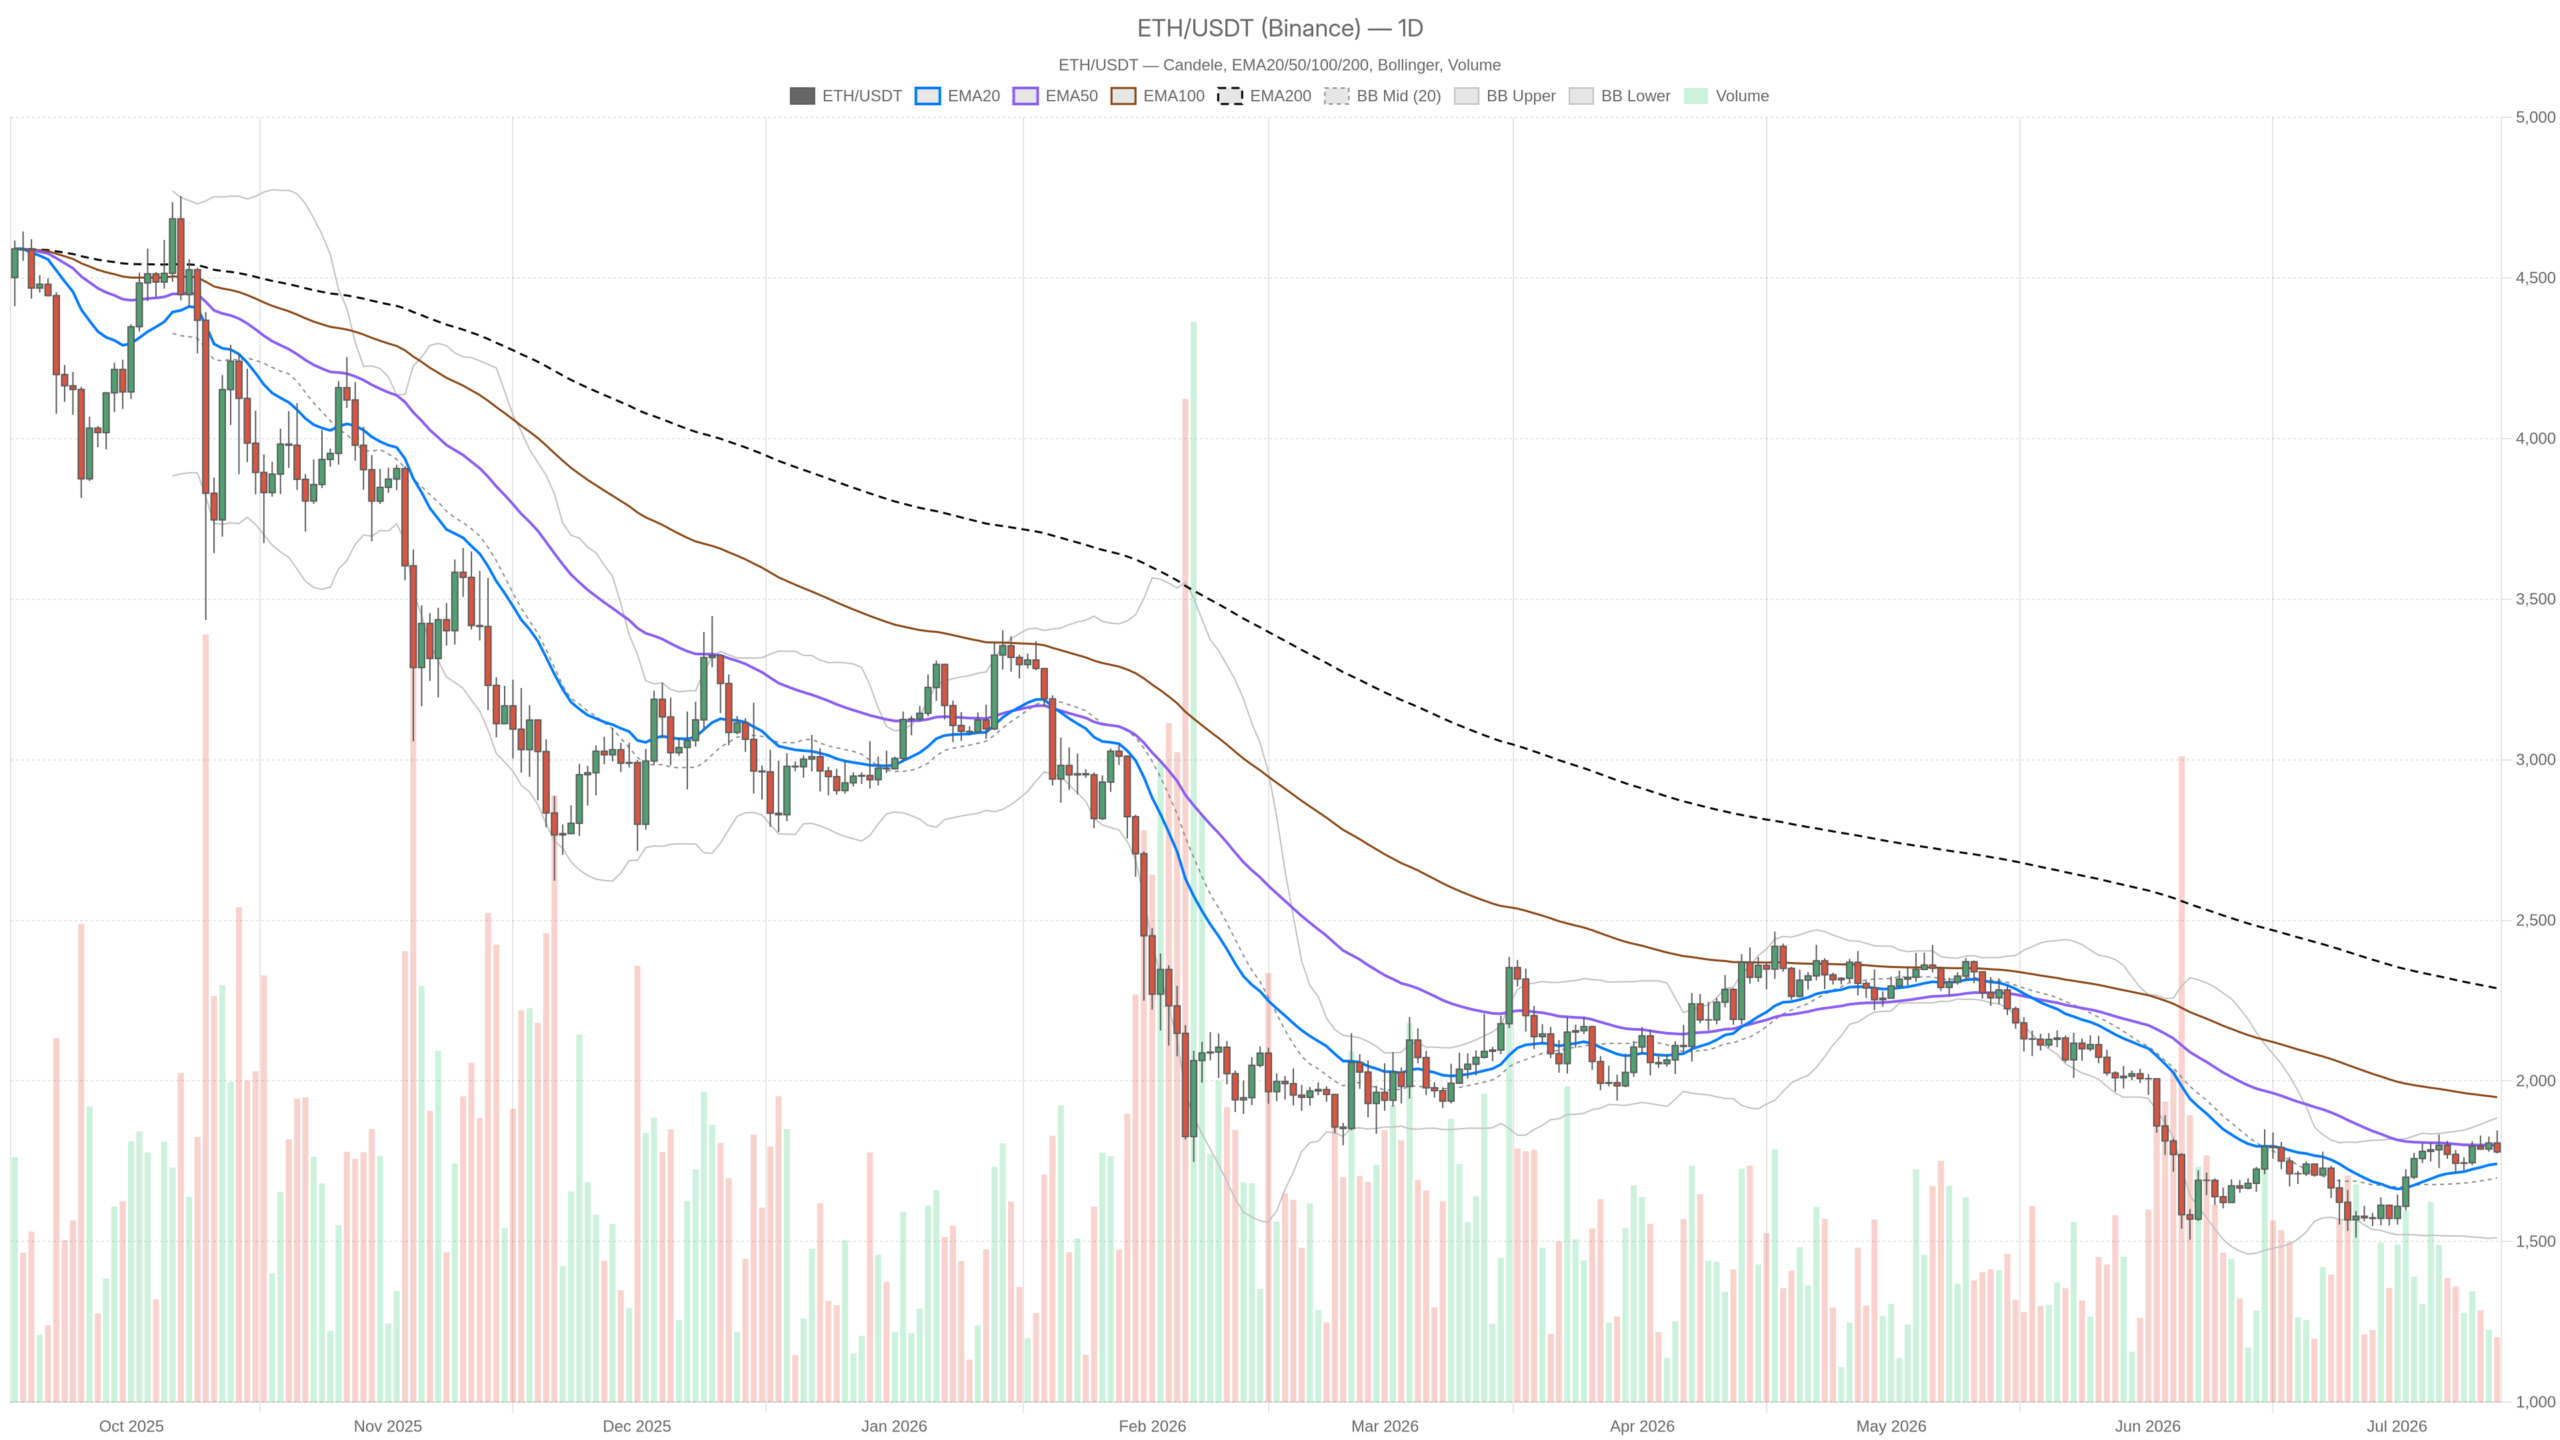
Ethereum’s daily chart shows a tentative recovery, with the price rising above the EMA20, indicating a new MACD bullish crossover. The closing price of $1,778.96 is above the 20 EMA of $1,742.05, which is constructive. The MACD line has exceeded the signal (+14.20 vs. -3.22), +17.42 histogram confirms the expanding bullish momentum. The RSI remains neutral to positive at 54.42, with room to rise before reaching overbought territory.
However, the broader structure requires caution. EMA200 is $2,288.50 means $ETH It is trading about 22% below its long-term moving average, but it is not a confirmation of a recovery, but rather a damaged chart that is aiming for stability. The EMA50 of $1,799.73 and the daily pivot of $1,799.65 converge, making the $1,799-$1,800 zone the most important level. R1 at $1,825.31 represents the next test above, and S1 at $1,753.30 provides the first floor of protection. The daily ATR is 71.31, so swings of this magnitude are completely routine.
What does the hourly chart reveal about short-term momentum?
The hourly chart is clearly bearish. $ETH Both are trading below EMA20 $1,799.10 The EMA50 is $1,800.62, confirming the $1,799 to $1,800 zone as active resistance. The RSI has fallen to 36.15, close to oversold, but not there yet. This means further downside momentum could still spill out before a natural rebound emerges. The MACD is clearly negative, with a line of -2.54 and a line of -7.08, and a histogram of -4.55, indicating that the sellers are not broken.
Nevertheless, one constructive factor in this time frame is the EMA200. $1,768.70below the current price and maintaining the medium-term time structure. $ETH is fixed in the compression zone. There is overhead resistance between $1,799 and $1,800, supported by the Bollinger lower band at $1,772.90 and the EMA200. Which boundaries you break with confidence will determine your next direction.
On the 15-minute chart, this regime is classified as bearish and is the only timeframe with a directional label. The price is $1,778.79, below all relevant EMAs. That being said, the MACD histogram has reached +0.50, the first positive record after a series of negative readings. This microdivergence is not a reversal signal, but it does suggest that selling pressure may slow down around current levels.
What are bullish and bearish scenarios? $ETH?
The way forward depends entirely on whether Ethereum can be reused. $1,800 level. If the hourly closing price is above that threshold, clearing the EMA20/50 cluster and the daily pivot, the short-term structure will change in favor of buyers. Daily MACD momentum and RSI of 54 supports a rally towards R1 at $1,825.31 and potentially the upper Bollinger Band at $1,884.48. The invalidation comes on a sustained break below $1,753.30, exposing the downside range towards $1,511.96.
Bears, on the other hand, require little imagination. If the price continues to reject $1,799-1,800 and the hourly RSI drops below 30, a retest will occur. $1,753.30 is the basic case. Below that level, there is a real structural gap before meaningful support emerges again. A daily ATR of 71.31 means you can cover that entire distance in one reverse session. The macro context — 28 fear index, 56% BTC dominance, 1.2% decline in crypto market cap — lends wind to this scenario. A strong daily bullish engulfing candlestick must close above $1,825 to deactivate.
What does DeFi activity tell us about market psychology?
A spike in DEX volumes suggests active reallocation among market participants, but in an environment dominated by fear, this does not necessarily indicate bullish accumulation. According to Defilama According to the data, Uniswap V3 fees increased by 48.84% in the past 24 hours and by 119.54% in 7 days. Curve DEX Similarly, it recorded a 1-day increase of 47.77% and a 7-day spike of 137.14%. The rise in on-chain transactions, with a Fear and Greed Index of 28, is as likely to reflect panic rotation as pure buying intent, and this is a data point to monitor, not a catalyst to rely on.
The tension between timeframes has made Ethereum price today a study of contradictory signals. The daily MACD crossover is real, but acting on it without confirmation above $1,800 per hour means buying directly into a resistance cluster. The volatility implied by the daily ATR 71.31 is large enough that positioning on the wrong side can quickly become painful. Until the $1,800 problem is resolved, patience and disciplined sizing are the only reliable methods.
FAQ
What is the current price of Ethereum?
As of July 13, 2026, Ethereum is trading at $1,778.96, above the daily EMA20 but below the key $1,799-$1,800 resistance zone formed by the EMA50 and the daily pivot point.
Is the Ethereum daily chart bullish or bearish right now?
The daily chart shows a cautious but constructive picture. $ETH closed above the EMA20 and the MACD recorded a bullish crossover with an expanding positive histogram. However, prices are still 22% below the EMA200, indicating that the long-term structure is damaged and attempting to stabilize rather than clearly recover.
What are the most important levels to focus on in Ethereum?
The $1,799 to $1,800 zone is $ETH Right now. This is a combination of daily EMA50, daily pivot points, and hourly EMA20/EMA50 clusters. A decisive pull above this zone would justify a bullish recovery call, but a sustained rejection would strengthen the bearish view towards support at $1,753.30.
Why have Uniswap and Curve fees skyrocketed recently?
According to DefiLlama, Uniswap V3 fees increased by 48.84% in 24 hours, while Curve DEX fees increased by 47.77%. Rising DEX activity often indicates active repositioning or hedging by market participants, and in a fear-driven environment can reflect panic rotation as much as genuine accumulation.
Disclaimer: This article is for informational purposes only and does not constitute financial advice, investment recommendations, or a solicitation to buy or sell any financial product or cryptocurrency. The analysis provided is not indicative of future results. Investing in crypto assets and financial markets involves a high risk of capital loss. Always do your own research (DYOR) and consult a qualified financial advisor before making any decisions.
Articles are created with the help of artificial intelligence and reviewed by our editorial team.


