


Ethereum has soared more than 25% since late March, pushing it back to levels that define the upper bound of its recent recovery range and testing resistance that has pushed it further beyond the upper bound of previous attempts. While this move is convincing enough to change sentiment, CryptoQuant analysts just pointed out discrepancies in on-chain data that complicate the bullish view and raise questions that price charts alone cannot answer.
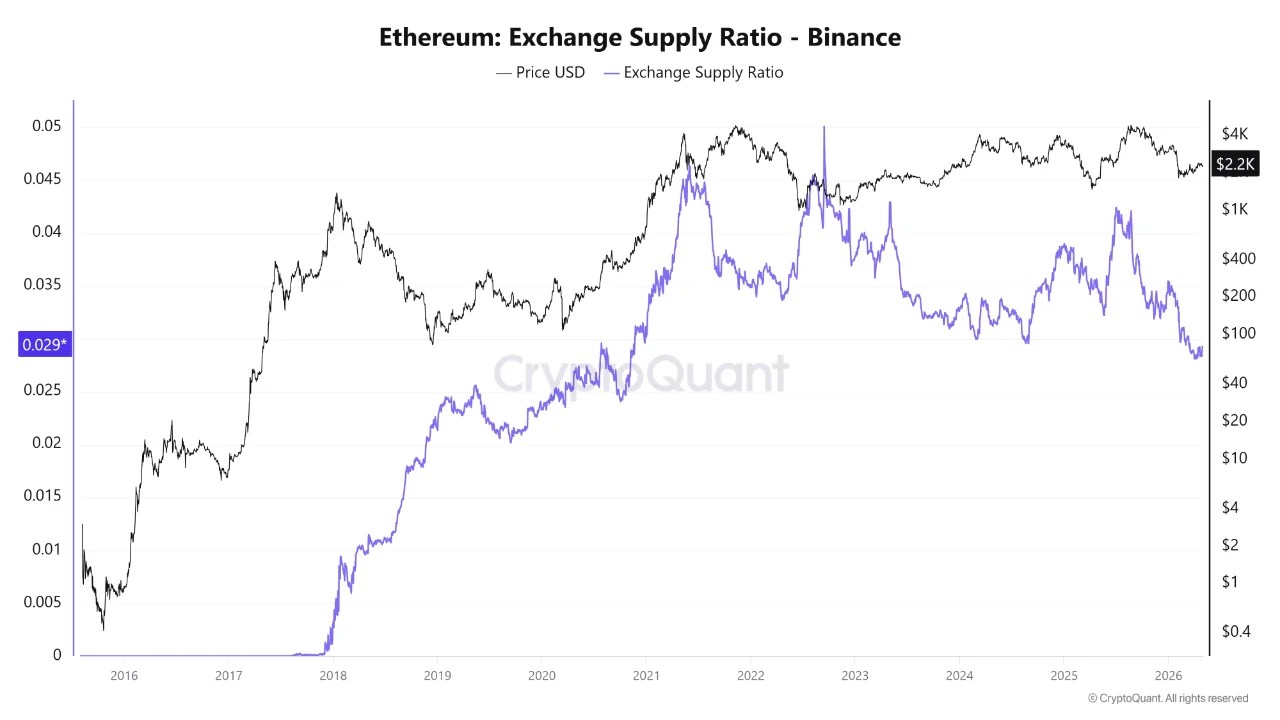
Analysts study the exchange supply ratio and the exchange supply ratio. This is an indicator that tracks the relationship between exchange supply and the broader market. Historically, a sharp decline in this ratio has been accompanied by a fall in prices, forming a bottom. The logic is simple. A decrease in exchange supply means fewer coins are available for immediate sale. This reduces selling pressure and indicates that the market is approaching a zone where prices tend to be supported.
The current chart shows that pattern, but we’re only halfway there. This ratio has fallen to low levels again, confirming the decline in exchange supply that the indicator is designed to detect. What’s missing is the price decline that historically accompanies it. Ethereum’s price continues to remain relatively high, rather than declining proportionately and forming a bottom.
It is this gap, between the ratio where a bottom should be forming and the price that has not yet corrected to form a bottom, that analysts have identified as a divergence that requires attention.
The ratio has bottomed out. Prices have not followed suit. The gap is shrinking.
CryptoQuant analysts’ interpretation of the divergence is straightforward and does not overly complicate what the data describes. The supply decline that the exchange-supply ratio tracks has already occurred and that part of the historical sequence is complete. What hasn’t happened is the corresponding price movement that has historically accompanied it. The market has received the signal but has not yet reacted as the pattern suggests.
Analysts have specific explanations for the delay. The effects of derivatives can sustain prices at levels that cannot be supported by the underlying spot market structure alone. If leveraged positioning creates artificial demand (a bid that exists due to borrowed funds rather than genuine purchase confidence), prices can remain resilient longer than on-chain data suggests. This resilience is not inconsistent with the signal. It’s a postponement of resolution.
The historical record of these differences is consistent. These do not tend to resolve to the upside, with prices increasing to justify the level increase. These tend to resolve to the downside and the price falls in line with where the ratio should be. The gap between where the ratio is and where the price is is the distance the market has to travel before they match.
Ethereum’s 25% rally since late March was real. The analyst’s warning is not that the recovery was wrong, but that prices may need to complete the bottoming process that this ratio has already shown. Dip may be delayed. Based on the data, it probably won’t be cancelled.
Ethereum regains structure but faces significant overhead resistance
Ethereum has rebounded from sub-$2,000 territory and is trading around $2,280, but the weekly chart shows the market is still caught between a recovery and structural resistance. Although the recent rally has been constructive as it has regained the 50-week moving average, prices are still below the 100- and 200-week moving averages and continue to trend sideways to down.
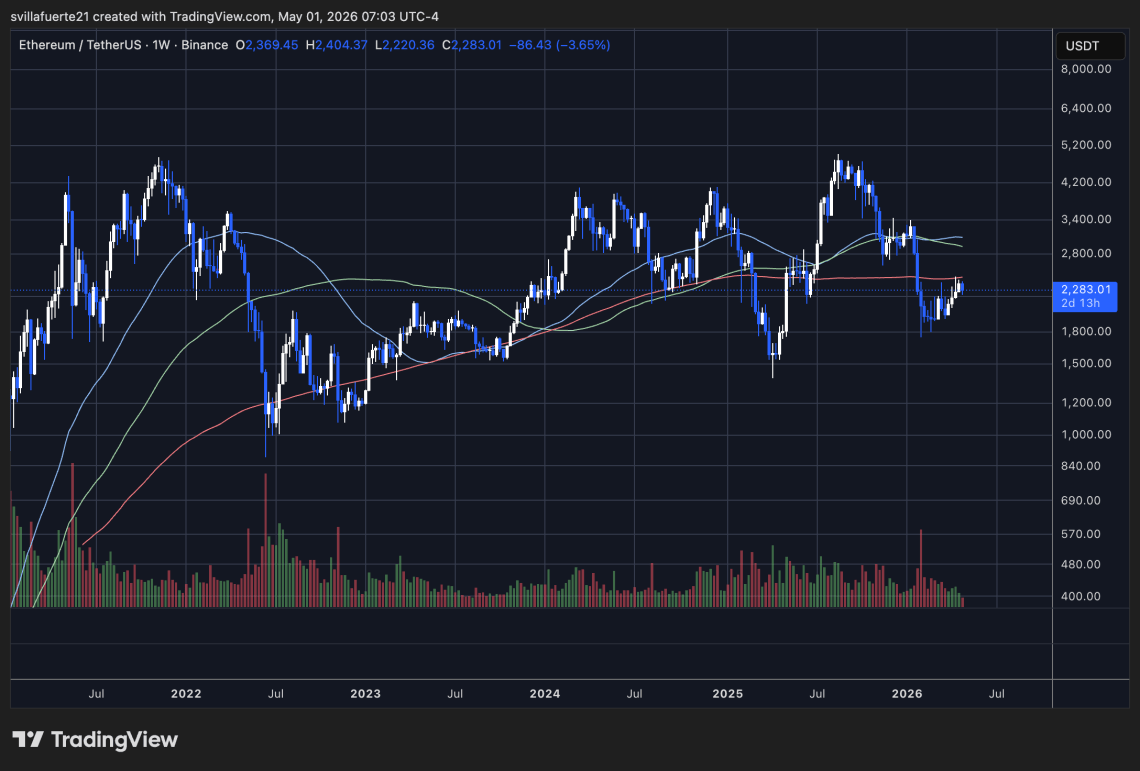
This positioning is important. Historically, sustained bullish expansions occur when Ethereum retakes and exceeds the average of these higher time frames. Until that happens, rallies tend to behave like relief moves within a broader consolidation or distribution range.
Currently, the $2,200-$2,300 zone is acting as a pivot. It previously served as a support during the 2024 structure, but is now being retested from below. Whether the market is able to sustain this level will determine whether the recent move develops into a trend reversal or if it falls to further lows.
Volume does not yet support strong conviction. Although the bounce from the low was large, follow-through buying was relatively modest compared to previous impulsive phases, suggesting cautious participation.
Above $2,600, the structure will change decisively, paving the way to $3,000. Failure to hold $2,200 will expose Ethereum to a new downside, with $1,900 acting as the next major support zone.
Featured image from ChatGPT, chart from TradingView.com