


Ethereum is being traded $1,674–$1,675the daily chart shows sustained selling pressure. The difference between the current price and the previous price represents months of lost momentum, broken support, and underwater holders. The trend is clearly bearish. However, the question remains whether this marks a depletion point that supports a rebound or a pause before further decline.
The time frame of the day tells the true story
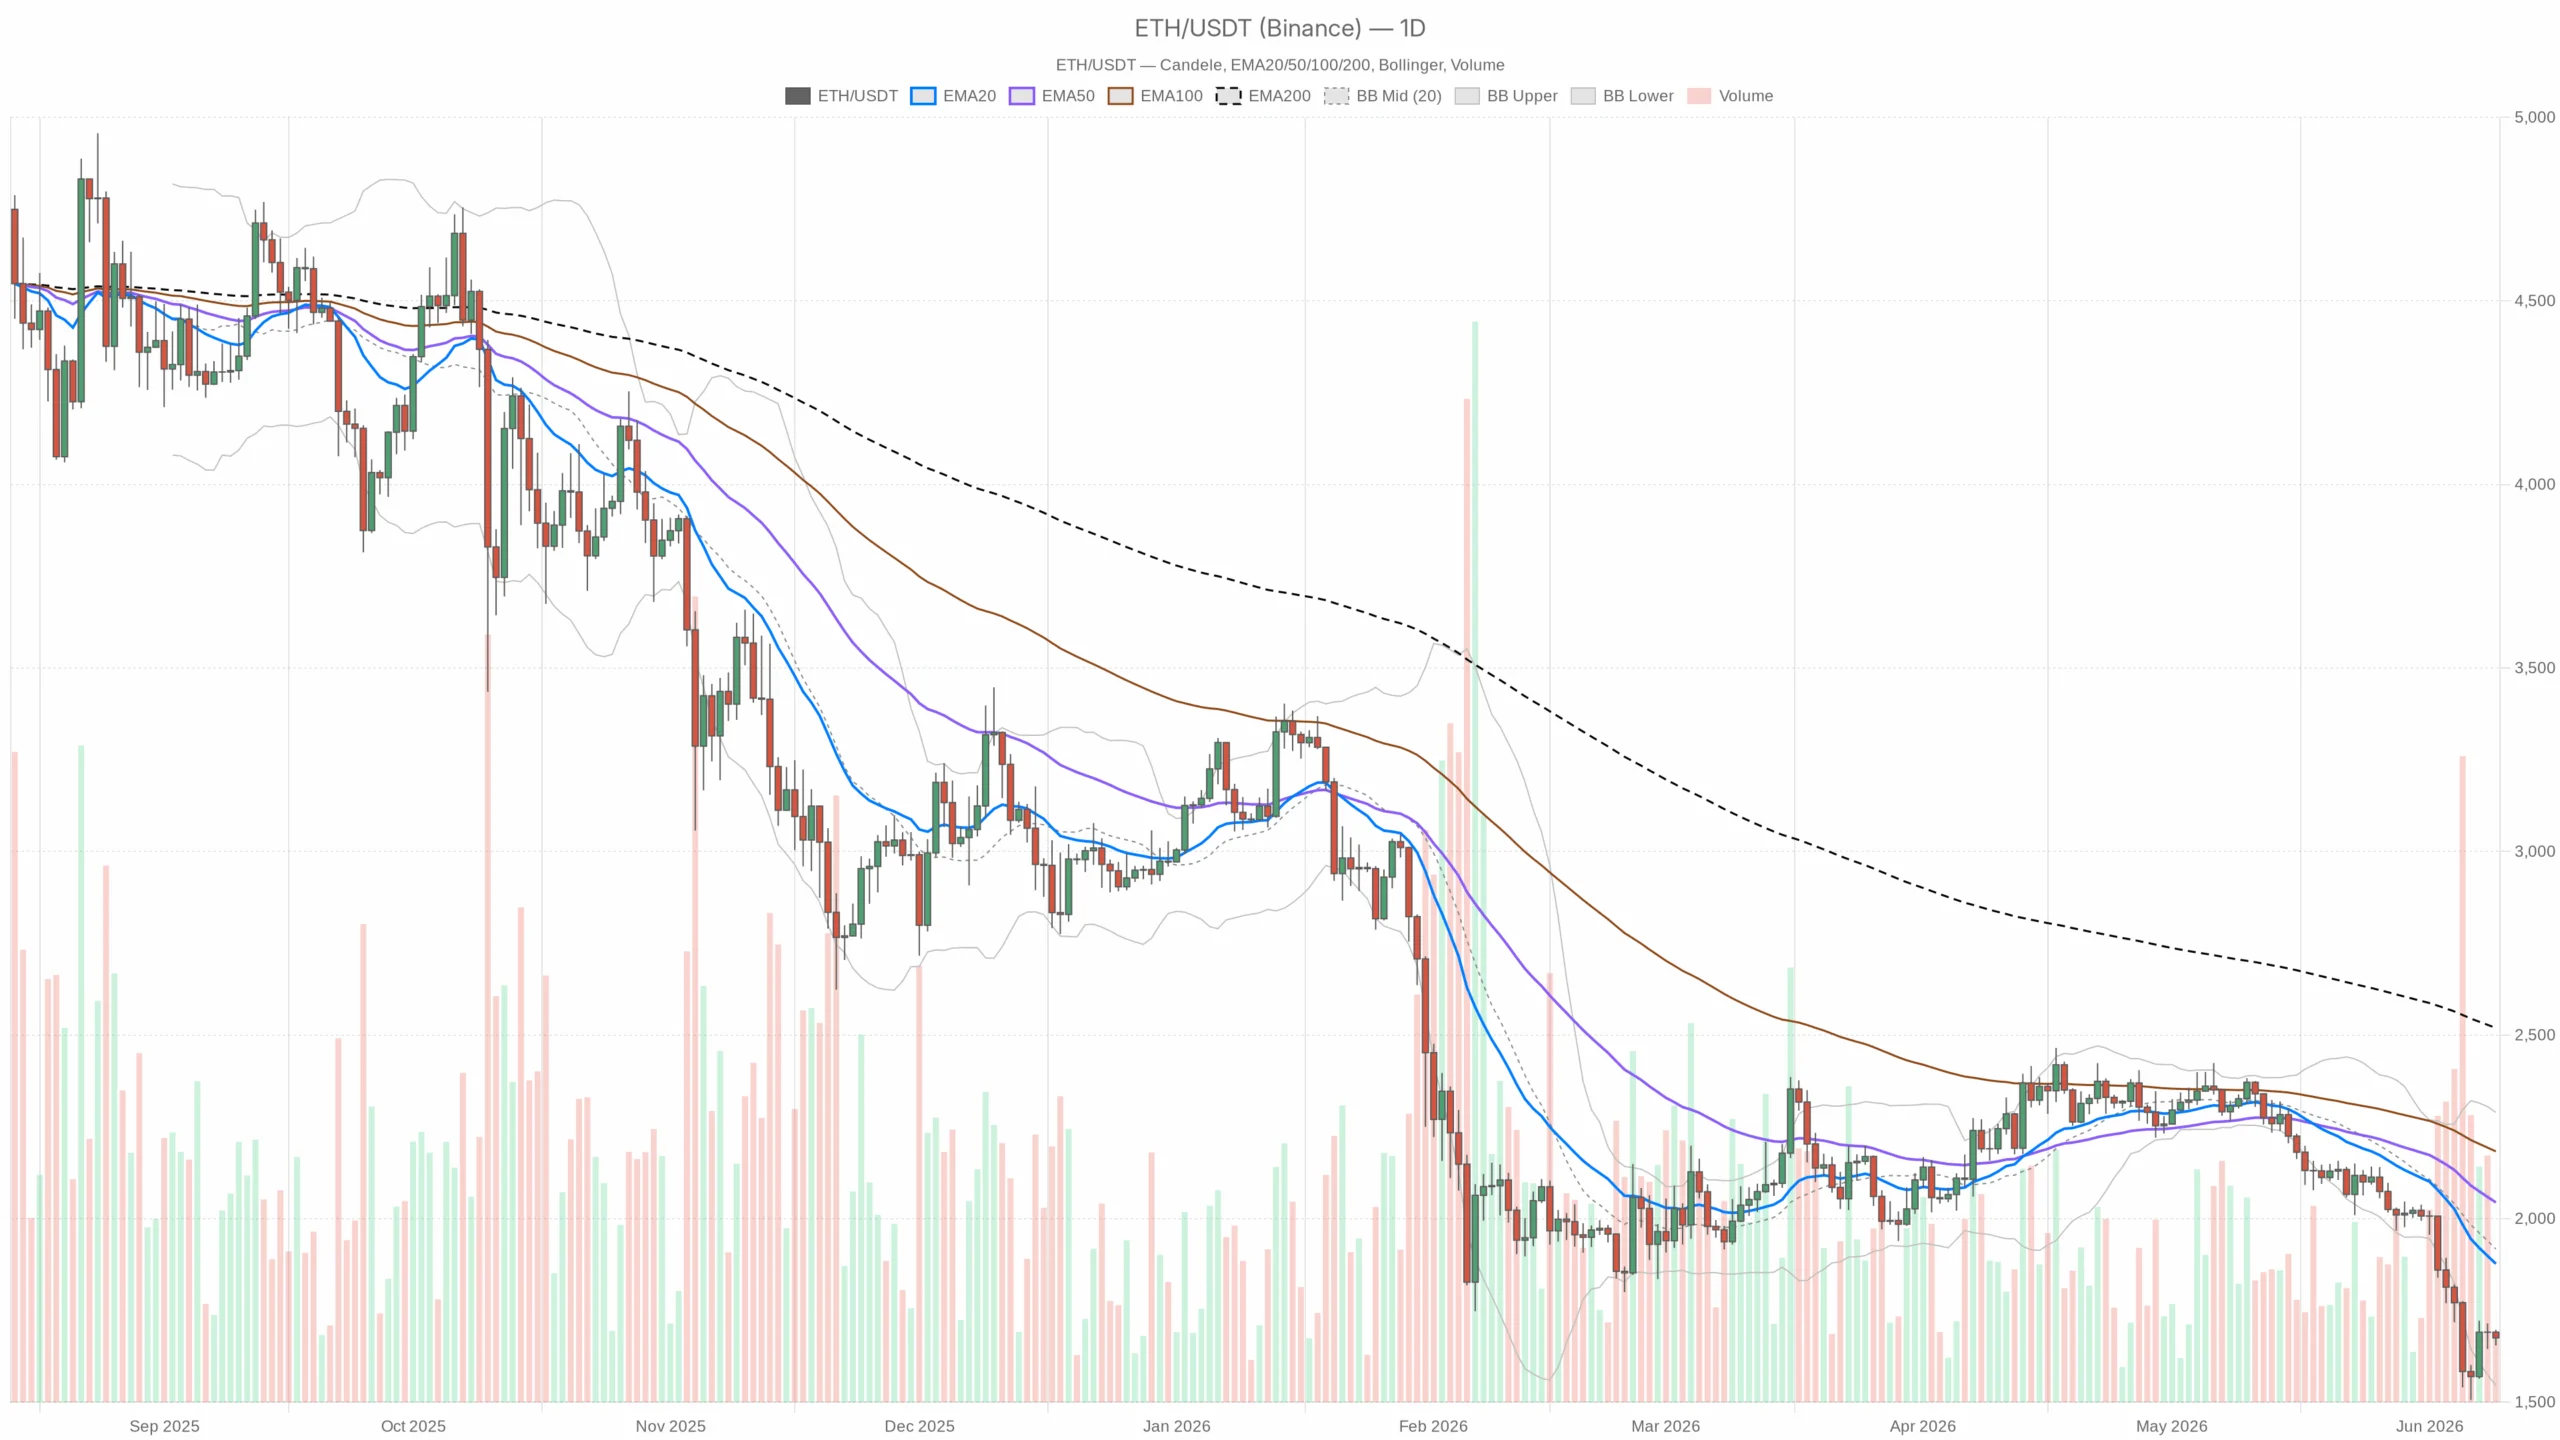
On the daily chart, Ethereum is below the EMA20 ($1,877), EMA50 ($2,044), EMA200 ($2,519), forming a bearish stack. A bullish approach will need to overcome these resistances before a healthy trend can resume. daily RSI 27.22 Technically oversold, which usually precedes a short-term easing, but could remain low during an extended decline. The MACD shows an accelerating downward momentum with a negative histogram. -24.31. Bollinger Bands indicate price compression, the lower band is $1,545.27 And ATR is $96.33 This suggests that there are large daily fluctuations.
The daily pivot points are tightly clustered with the PP. $1,675.56with R1 $1,696.48and in S1 $1,654.23does not reflect a clear directional bias. Price is on a pivot, indicating hesitation among buyers and sellers during the session.
Hourly chart: flicker of indecision
The hourly chart slightly tempers the bearish theory. First half EMA50 is $1,665.70 EMA20 is currently below the price, $1,679.23 It’s nearby. 200 EMA per hour $1,740.20 Significant resistance still remains. RSI per hour 49.21 is neutral and the MACD displays a bearish crossover, warning that the short-term rebound may be running out of energy. The Bollinger Bands for this time frame also suggest a neutral stance with the price near the midline.
15 minutes of context: For those viewing the entry.
The 15 minute chart is not so clear. Prices are for both 15m EMA20 ($1,680.77) and EMA50 ($1,681.28). The MACD crossover is mildly bearish and the RSI is bearish at 42.98. The 15-minute pivot levels are very tight, with only a $1 difference between them, suggesting a sharp rise is imminent, although the direction remains uncertain.
The DeFi angle: Activity surges despite low prices
In contrast to the price slump, DeFi activity on Ethereum is surging. Uniswap V3 fees soared 143% in one day, Fluid DEX 256%, and Curve nearly 55%. Rising DEX fees indicate actual on-chain volume and active network usage, which historically supports Ethereum’s fundamental value.
Two scenarios worth taking seriously
of bullish case Oversold daily RSI, extreme fear sentiment at 10/100, dependent on daily pivot support $1,654–$1,675the Bollinger lower band serves as the floor. Stabilization and recovery here $1,700 volume can cause a rise in $1,800–$1,880. Conversely, the closing price below $1,545 This would negate this and open a deeper decline.
of bearish continuation case It is supported by the daily EMA stack, expanding MACD histogram, and price below the major moving averages. failure $1,654 Increasing amount of support can bring prices down $1,545 and towards $1,400–$1,450. Daily closing price above EMA20 $1,877 This bearish outlook will be invalidated.
How to think about positioning now
The current configuration is dangerous in both directions. A bearish daily structure, as opposed to an oversold or extreme fear situation, creates the potential for a sharp short squeeze. ATR’s $96 It means high volatility and risk. Holders please be careful $1,545 Bollinger floor approaches. Those wishing to enter must wait until a bounce is confirmed or a clear recall is made. $1,700. A tight 15-minute pivot signals an impending move, and this situation usually favors the downside.
While Ethereum’s network activity remains resilient, the price has not. This disconnect will resolve over time, but the timing remains uncertain.