


Ethereum We are at one of the most sensitive times in recent months. of $ETH Today’s price is $1,768.96this level is more than just a number. This is a snapshot of an asset that is systematically losing ground, trading below all relevant moving averages, and still attracting sellers even though the RSI is already deep in oversold territory. The question is not whether the trend is bearish, which it clearly is, but whether this point represents an opportunity or just a trap for those hoping for a rebound at all costs.
Macro context is useless: crypto market capitalization is lost 4.67% in the last 24 hours, Bitcoin is dominant with more than 55% advantage, and the Fear & Greed Index is 12 — extreme fear. When fear reaches this level, price movements no longer follow pure technical logic and begin to reflect the emotional pressure of capitulated holders.
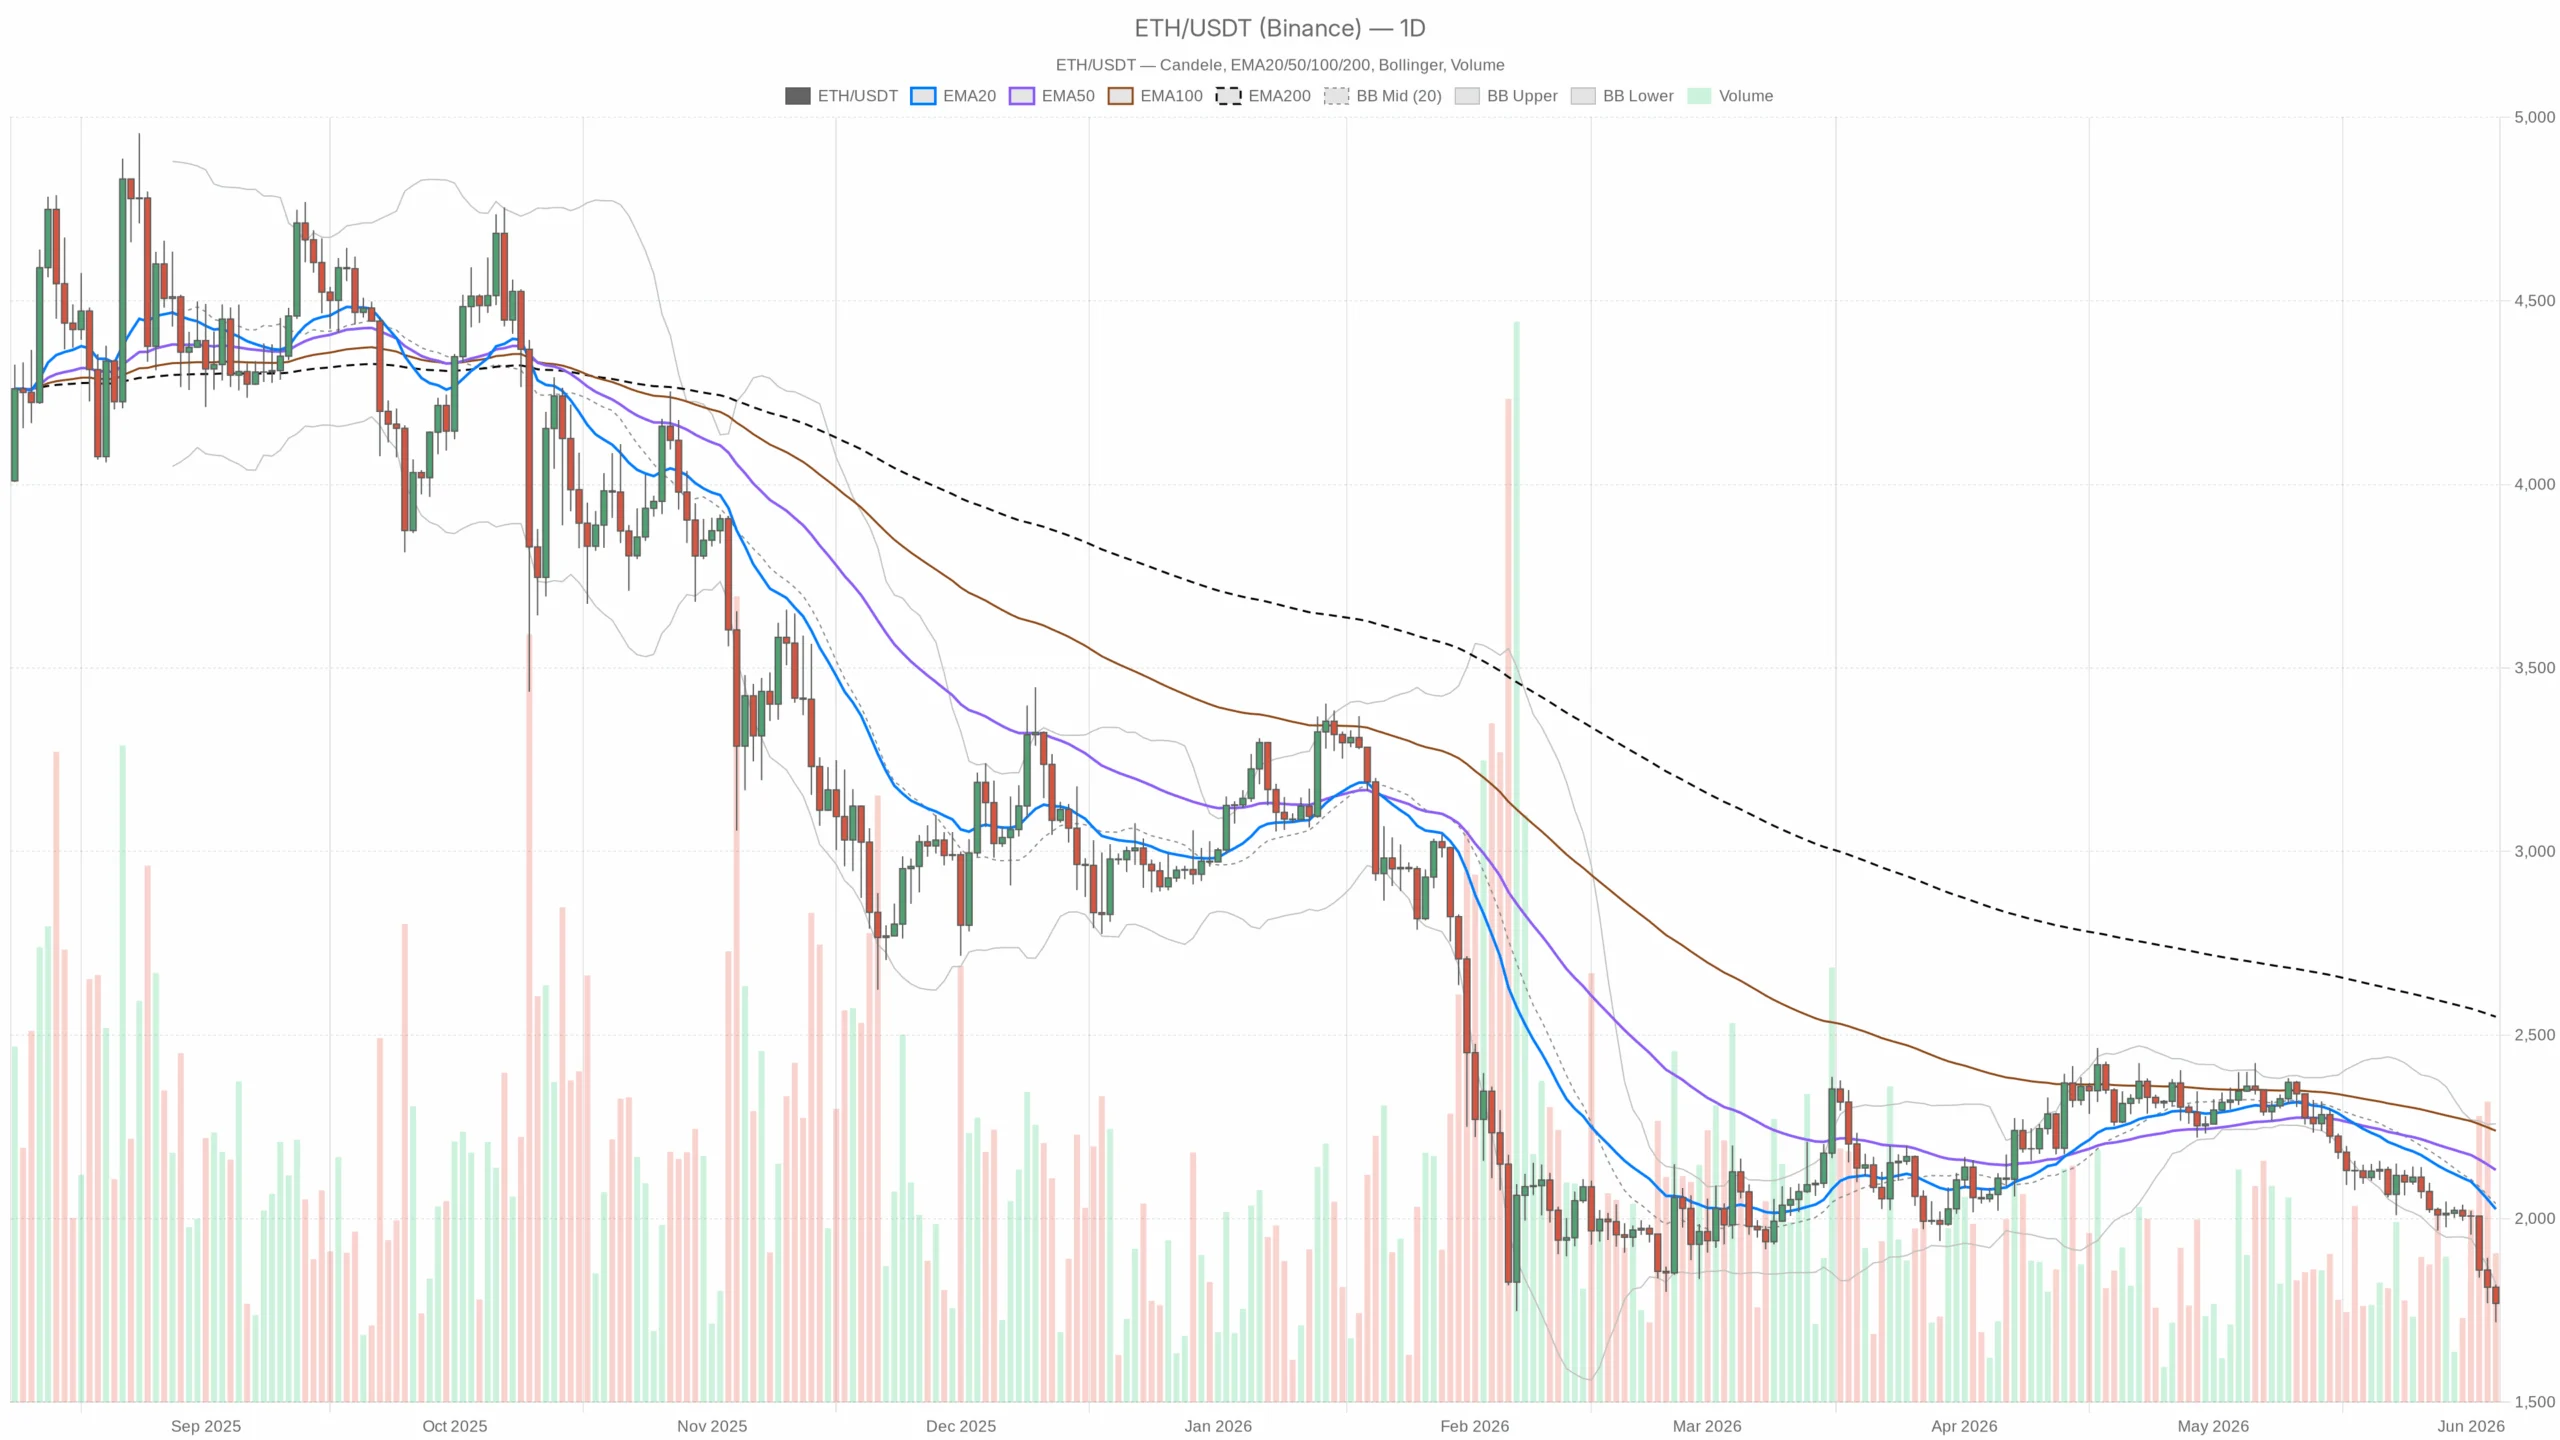
The daily structure says it all.
○In the daily time frame, the situation is clear. $ETH is traded at $1,768.96well below EMA20 $2,025at EMA50 $2,132 And EMA200 is $2,549. All three exponential moving averages are tilted to the downside and are perfectly aligned in a bearish configuration, with price unable to even approach the shortest of them. All recovery attempts fail before reaching the first dynamic resistance.
The daily Bollinger Bands show the following bands: $1,823 — and prices are already below that, too. If an asset falls below the lower Bollinger Band on a daily basis, it is not just growing, but indicates selling pressure that exceeds the statistically expected volatility. The middle band is $2,040 Now it is not a support, but a distant ceiling.
The daily 14-period RSI is: 18.25. This is a number that must be emphasized. We are well beyond the typical 30 norm and in extremely oversold territory. In theory, this should expect a technical rebound. In reality, an RSI this low in a strong directional trend can remain compressed for weeks and continue to decline until prices stabilize or briefly rebound. This is not an automatic buy signal, but rather a warning of intense and sustained selling pressure.
The same thing can be seen with the daily MACD. -100.16at a traffic light -74.25histogram at -25.91. The MACD line is still below the signal and the histogram remains negative with no sign of an upward turn. There is no divergence or weakening of bearish pressure on the daily chart. Momentum remains downward.
14 period ATR is $84.08: Average daily volatility above $80In this context, this translates into sharp, hard-to-predict movements within a single session. trading $ETH Intraday at the moment means accepting large fluctuations in a very short period of time.
The daily pivot level indicates the next major pivot. $1,768.91 — roughly in line with the current price — the resistance R1 is $1,820.55 and support S1 $1,717.33. The fact that the price is exactly on the pivot is not neutral. This means that the market is in a stage of unstable balance, where a strong push in one direction can activate the next level.
The 1-hour and 15-minute charts support this, but with different nuances.
○On the 1 hour chart, $ETH It is located in $1,764.68 At EMA20 $1,808at EMA50 $1,858 And at EMA200 $1,961. Again a compact bearish structure. RSI per hour 36.39 is not oversold yet, but it is clearly depressed and lacking momentum. The hourly MACD presents an interesting picture. -26.63 and at the traffic lights -26.39the histogram is effectively zero (-0.24). This near convergence between the line and the signal may indicate that short-term bearish pressure has temporarily dried up, but this is not a reversal signal and is at best a pause.
The hourly Bollinger Bands show the following bands: $1,746.89: Prices are between low and mid-band in the compression area. This is a typical situation for a technical rebound, but if there is no catalyst, there is a risk that we will see a sideways movement near the lows rather than a definitive recovery.
The situation is similar with M15. The price is $1,764.49 It is trading just above the lower bound of the Bollinger Band ($1,764.16), RSI is 37.53 The MACD is still negative and the histogram is as follows. -2.42. Trading conditions do not provide a clean setup. All rebounds are sold before reaching major resistance and the short-term structure remains weak.
Bullish scenario: exists but requires solid confirmation
FOr a rebound to become trustworthy, $ETH First you need to recover and close steadily on $1,820-1,823 — The R1 resistance of the daily pivot aligns almost exactly with the lower bound of the daily Bollinger Band, creating a resistance cluster that the price must fully absorb. Above is the closing price for 1 hour $1,820 As the volume expands, $1,870~1,900this is the area where the short-term EMA on the hourly chart is concentrated.
This scenario is disabled if the price is $1,820 It will accelerate downward again in the next few hours. daily RSI 18 A pullback is possible even without structure, but unless strength is confirmed, the pullback risks becoming a trap for hasty buyers.
Bearish scenario: path of least resistance
TThe main trend is bearish in all three analyzed time frames. Daily S1 support is $1,717.33 It is the first natural target if movement continues. Below that level, the technical structure does not provide significant support. $1,600-1,650 This area is where older historical lows are located and where long-term buyers may step in.
This bearish scenario is only invalidated if the daily closing price is above. $1,870a level that brings price back within the daily Bollinger Bands and indicates a change in pressure. Until then, all rebounds should be treated as potentially salable.
How do we read this moment?
TEthereum price today is at a point of maximum pressure. Daily RSI is low, price is below all moving averages, fear and greed are 12. In these markets, the most experienced traders don’t try to predict the bottom, they wait for it. RSI 18 This does not mean that prices cannot fall further. The speed of the decline is unusual, meaning that the market is technically exhausted but not necessarily ready for a reversal.
The most concrete risk at the moment is false rebound. That means accelerating a few percentage points toward your goal. $1,820-1,830 That attracts buyers and then a new bearish leg pushes prices down $1,717. This pattern, a rise in a downtrend and then a fall, is exactly what characterizes the final capitulation, but it also creates the greatest loss for those who bought thinking it was the bottom.
Anyone who trades $ETH Today, we must have one priority: risk management. Levels exist and direction is clear, but ATR volatility is $84 According to per day, surprises in both directions are commonplace.