

Ethereum is trading around $1,644, approximately 67% below its all-time high of $4,946 on August 24, 2025. This is because a combination of macro pressures, sustained ETF outflows, and Bitcoin’s growing dominance have pushed the second-largest cryptocurrency to its weakest relative position in years.
Important points:
- Ethereum is trading around $1,644, down 66.8% from its all-time high of $4,946 in August 2025.
- The Spot Ethereum ETF recorded $241 million in outflows in a single week, and BlackRock temporarily reversed the trend.
- Ethereum’s DeFi TVL holds nearly $37 billion as of June 2026. $ETH The advantage was compressed to about 9%.
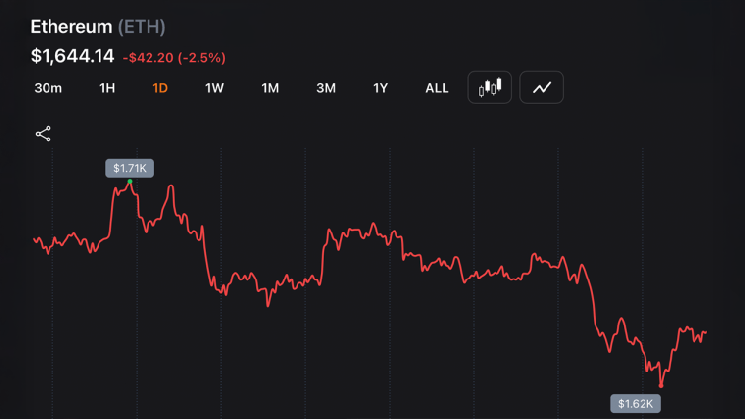
$ETH Look at the numbers
As of June 9, 2026, $ETHThe 24-hour range is between $1,619 and $1,712, and the 7-day range is between $1,522 and $1,909. Tuesday at 2:30pm EDT, $ETH $1,644 per unit. Performance across the time frame paints a bleak picture.
- 24 hours: -2.6%
- 7 days: -14.5%
- 14 days: -20.9%
- 30th: -30.5%
- 1 year: -35.9%
Ethereum has a market capitalization of nearly $199 billion. While Bitcoin’s lead was close to 58%, its lead has been compressed to approximately 9.1% to 9.3%.
why $ETH I’m having a hard time
Analysts point to several overlapping pressures. Bitcoin’s dominance of nearly 58% reflects the preferences of financial institutions. $BTC Increased inflows to spot Bitcoin exchange-traded funds (ETFs) have further enhanced its value as a store of value. of $ETH/ $BTC This ratio reached a low level around 0.027 in May, suggesting significant turnover from Ethereum during a period of macro uncertainty.
Spot Ethereum ETF added to the headwinds. In a series of outflows spanning several weeks, approximately $241 million was lost in one week. A one-off $19 million influx led by BlackRock helped eliminate a 17-day outflow surplus, but it was only temporary relief. One convertible fund recorded approximately $3 billion in redemptions after the ETF conversion, reflecting selling pressure that had built up before the product was launched.
The macro situation didn’t help. Analysts, including Fundstrat’s Tom Lee, have warned of an inverse correlation between oil and oil prices. $ETHsays the relationship has reached a historically high level. Sticky inflation, geopolitical tensions, and widespread risk-off sentiment are weighing further on high-beta assets such as: $ETH than Bitcoin.
Upgrade trade-offs
The Pectra upgrade, activated on May 7, 2025, introduced account abstraction with EIP-7702 and increased the maximum validator stake to 2,048. $ETHand scale BLOB throughput to reduce Layer 2 charges. The December 2025 Fusaka upgrade extends these scaling improvements. Both are believed to be positive for Ether’s ease of use and adoption in the long term.
However, with the reduction in base layer fees, $ETH Flaming under EIP-1559, the deflationary pressures previously sustained are relieved. $ETHThe story of the price. Combined with layer 2 (L2) activity that pulls transaction volume from mainnet, some analysts argue $ETH In the short term, it is evolving into infrastructure rather than gas tokens, which are in high demand.
The bull case remains intact.
Despite the drawdown, many supporters believe that Ethereum’s fundamentals remain among the strongest in history. Decentralized Finance (DeFi) Total Value Lock (TVL) on Ethereum mainnet stands at nearly $37 billion, still the largest by a wide margin. Developer activity, institutional tokenization experiments, and real-world assets (RWA) narratives continue to support Ethereum as the primary smart contract payment layer.
Staking also provides a structural demand floor. $ETH Locked-in supply to validators yields returns of approximately 2% to 4% APY. The Gramsterdam upgrade, scheduled for late 2026, aims to improve MEV equity and efficiency.
Recovery will likely depend on a macro shift to risk-on sentiment, a shift away from Bitcoin dominance, and continued execution of Ethereum’s roadmap.