

Ethereum continues to show signs of strength after a long period of weakness, but the broader structure remains cautious. The price trend on the daily chart shows a gradual recovery supported by higher lows and stabilizing sentiment.
However, sellers remain active near a major resistance zone, preventing a definitive breakout. As a result, the market is now at a critical juncture whose direction will depend on whether buyers can maintain momentum or fall under pressure.
Recovery faces structural resistance
Ethereum’s recent rally reflects an improvement in short-term sentiment. After the sharp decline, buyers stepped in and formed a rounded base.
This pattern often indicates accumulation, especially when combined with rising lows. However, prices remain below major moving averages, limiting bullish confidence.

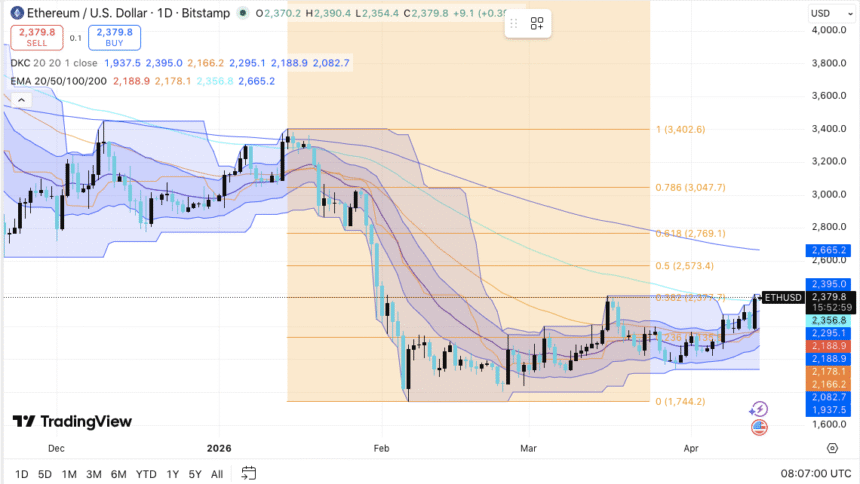
Additionally, the $2,400 to $2,450 range continues to serve as a solid upper limit. Each rejection reinforces the hesitation among traders.
If buyers break above this zone, momentum could accelerate towards $2,570. This level represents an important turning point where market confidence becomes clearer.
Related: Bitcoin Price Prediction: BTC consolidates as market eyes $75,000 breakout zone
Additionally, the $2,770 area is a critical barrier. A break above this will likely confirm a broader trend change. Until then, Ethereum remains in a transition period rather than a solid upward trend.
Support zone and downside risk
On the downside, there are still some support levels that define market stability. Currently, short-term structure support is in the $2,300 to $2,250 range. A break below this area could quickly weaken the bullish momentum.
Additionally, the $2,180-$2,080 zone has gained importance due to clustered technical indicators. If the price falls below this area, sellers may gain more control. The $2,000 level also has psychological weight and often attracts intense trading activity.
As a result, a loss in the $2,200 to $2,000 range could trigger an even deeper decline towards previous lows. Traders continue to closely monitor these levels as volatility increases.
Market signals suggest compression
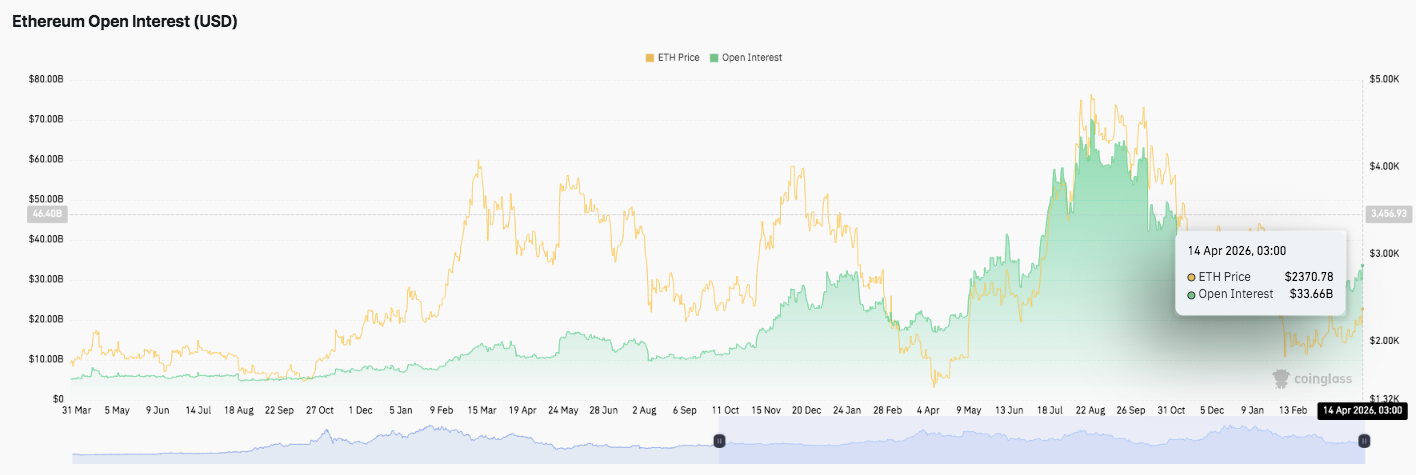
Beyond price trends, derivatives and flow data reveal changes in sentiment. Open interest is starting to recover after a noticeable contraction. This rally suggests that traders are returning cautiously rather than aggressively.
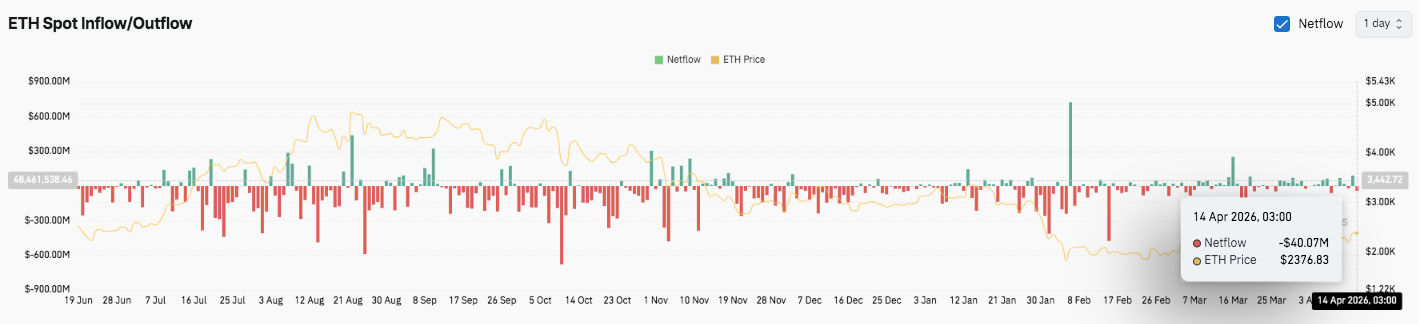
Additionally, spot market flows show declining outflows and occasional spikes in inflows. This change indicates that selling pressure is gradually easing. Additionally, balanced flows often suggest consolidation before large-scale moves.
Technical outlook for Ethereum price
As Ethereum goes through a consolidation phase for the next market cycle, key levels remain clearly defined. Price trends continue to be compressed between support and resistance zones, indicating the possibility of more volatility ahead.
Top level: The $2,400-$2,450 level serves as an immediate resistance level that sellers have repeatedly intervened with. A break above this zone could start a move towards $2,570, followed by $2,770 as a major trend reversal level. If the momentum strengthens further, $3,000 and $3,400 will become medium-term upside targets.
Related: Pi Network Price Prediction: PI tests final support as Protocol 23 upgrade approaches
Lower price level: $2,300-$2,250 remains the first support zone where buyers defended the structure. Below that, $2,180 to $2,080 forms a strong demand area along the major moving averages. A breakdown below $2,000 would signal a more severe correction risk towards $1,740.
Upper limit of resistance: $2,770 is at a key level for a reversal towards a broader bullish transition. Ethereum needs to regain this zone with strong volume to confirm a medium-term trend change.
Technical conditions indicate that Ethereum is compressing within a tightening range after recovering from a sharp downtrend. This structure reflects an accumulation behavior, but confirmation still depends on the strength of the breakout.
Will Ethereum go up?
Ethereum’s near-term outlook depends on whether buyers can defend the $2,200-$2,250 region long enough to counter the $2,400-$2,450 resistance. This zone acts as the first true test of bullish beliefs.
Furthermore, the improvement in momentum and stabilization of flow suggest an early recovery state. However, the broader trend remains uncertain as prices trade below key long-term averages.
If strong buyer inflows push Ethereum above $2,570, it could push toward $2,770 and decisively change the market structure. Further strength above this level will likely allow for a continuation towards $3,000 and above.
However, failure to hold $2,200 will weaken the recovery regime and expose Ethereum to renewed downward pressure towards $2,000 and $1,740. As a result, the market continues to be in a critical compression phase.
RELATED: Terra Classic Price Prediction: LUNC Holds Above 4 EMAs As Upbit Suspends Withdrawals Ahead of April 17th Upgrade