


Ethereum ($ETH) is showing signs of recovery, trading above $2,280 on Friday after finding support at a key level, providing some relief after a 3.5% decline so far this week. However, the Federal Reserve’s hawkish tone, uncertainty surrounding the US-Iran peace talks, and weak institutional demand continue to weigh on risk sentiment. This combination leaves us with $ETH Traders are wary of a situation where a sustained pullback or further decline could set the short-term trend.
Hawkish Fed and war between US and Iran weighs heavily $ETH
Ethereum extended its correction midweek, posting losses for three consecutive days and closing below $2,260 on Wednesday. This price drop comes amid the Fed’s hawkish leanings and the US-Iran standoff, favoring US dollar (USD) bulls. $ETH.
As expected by most market participants, the Federal Reserve decided to keep interest rates unchanged at its 3.50% to 3.75% range at its April meeting on Wednesday. Notably, this decision received the highest number of dissenting voices since 1992, with three policymakers voting against the accommodative tone of the policy statement, and another voting against it in favor of rate cuts.
Outgoing Fed Chairman Jerome Powell made it clear in his post-meeting press conference that the discussion was about neutrality of tone, not about the need to raise interest rates. But traders have sharply reduced their bets on further Fed easing in 2026, now pricing in a more than 10% chance of a rate hike by December, according to the CME FedWatch tool.
The decision comes as peace talks between the United States and Iran stall, and soaring energy prices caused by the war are fueling inflation concerns. As geopolitical risks continue to weaken market-wide risk sentiment, uncertainty surrounding the second round of negotiations in the Middle East conflict has emerged as a short-term factor constraining the upside of risk assets.
However, Thursday’s earnings reports from major US tech companies provided a mild boost to the crypto market, with Ethereum recovering slightly. As of Friday, $ETH continues to recover and is trading above $2,280.
Institutional investor demand shows signs of caution
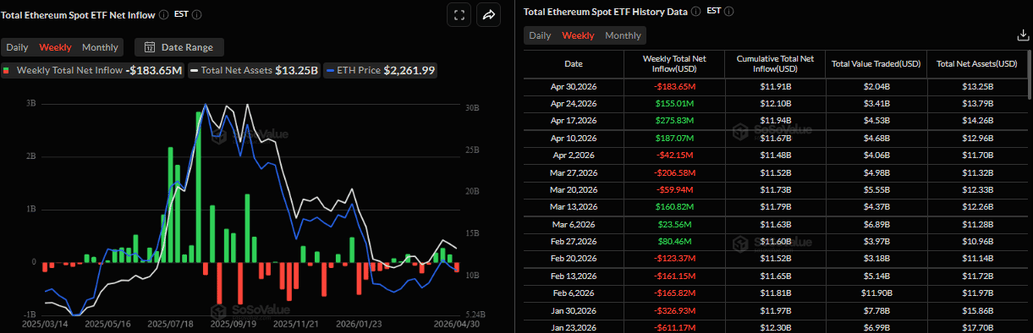
Institutional demand for Ethereum remained cautious this week. SoSoValue data shows that $ETH Spot ETFs recorded outflows of $183.65 million through Thursday. If these outflows continue on Friday, it could end a third consecutive week of inflows and put further downward pressure on Ethereum’s price.
On the corporate side, Bitmine Immersion Technologies (BMNR) announced on Monday that its total holdings in Bitmine (cryptocurrency + total cash + “moonshot”) totaled $13.3 billion.
“Bitmine $ETH Last week, our holdings exceeded 5 million,” said BitMine Chairman Thomas “Tom” Lee.
Mr. Lee continued, “This is a major milestone as we move towards acquiring a 5% stake.” $ETH supply. And the pace of this accumulation is astonishing, reaching 5 million in just 10 months. ”
Mixed sentiment in derivatives markets
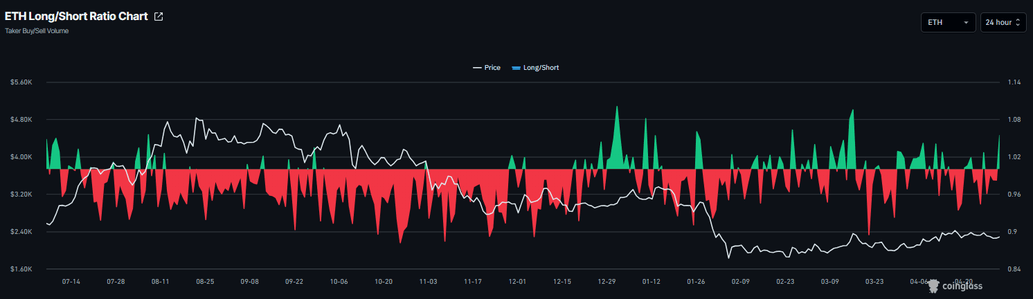
Derivatives data shows mixed sentiment among traders. CoinGlass long-to-short ratio $ETH It stood at 1.03 on Friday, nearing its highest level in a month. This ratio above 1 reflects bullish sentiment in the market as more traders are betting on asset prices rising.
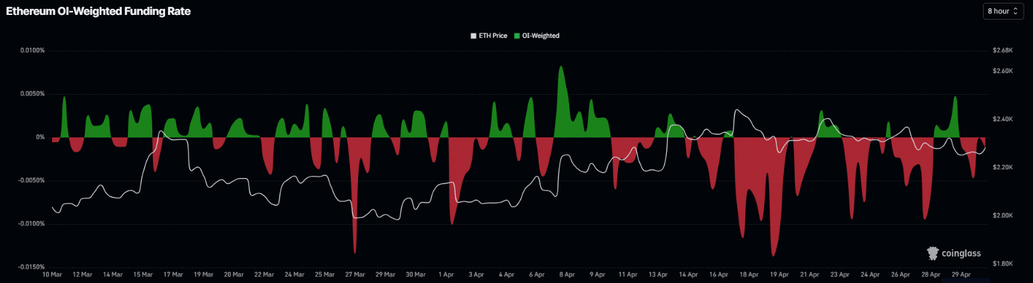
However, funding rates confirm the bearish bias. CoinGlass OI-weighted funding rate data $ETH It turned negative on Wednesday and remained negative at -0.0012% on Friday. This negative interest rate shows that shorts are paying the price of longs, suggesting bearish sentiment.
This combination suggests that there is indecision among people. $ETH Investors and a lack of clear directional bias limit the potential for a sustained recovery.
What’s in store for Ethereum in May?
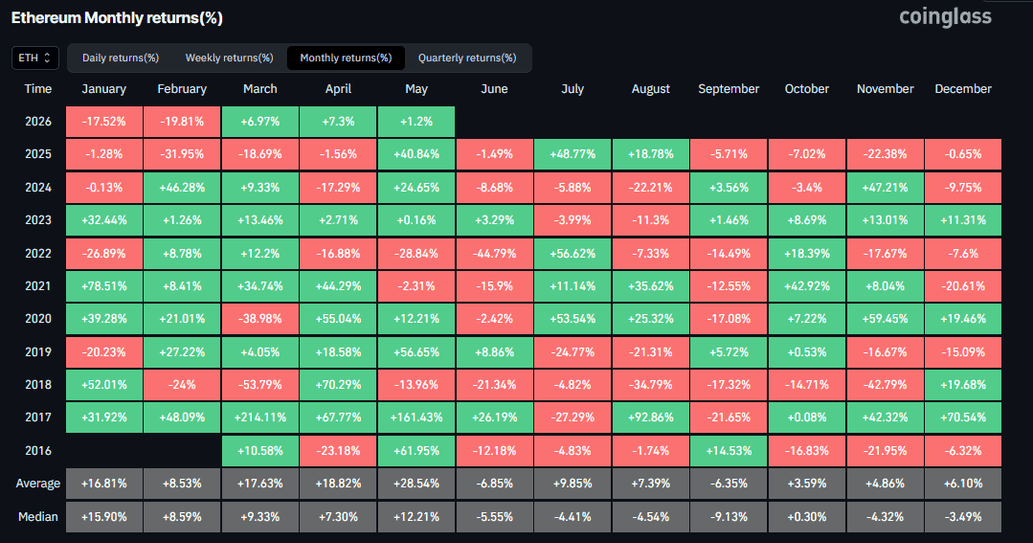
Ethereum price ended April with a positive return of 7.3%, marking its second straight month of gains so far this year, as shown in the chart below.
However, monthly trends suggest signs of optimism. Historically, Ethereum has delivered positive returns in May, with an average gain of 28.54%. This recovery theory could play out if institutional capital flows resume, regulatory developments shift toward supporting the broader crypto market, and the Middle East wars end, which could restore investor confidence and risk appetite.
Technical outlook: Core support remains strong
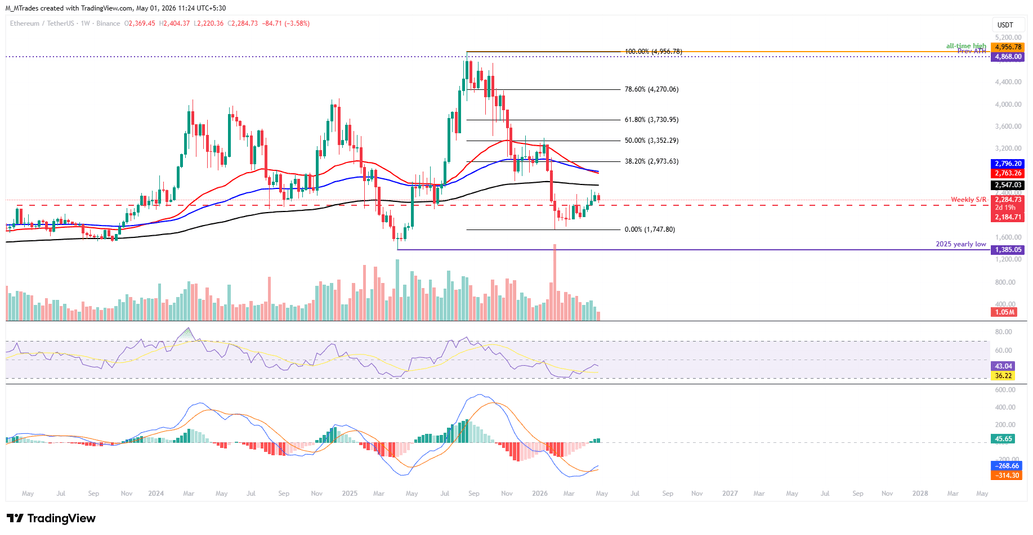
On the weekly chart, the second-largest cryptocurrency by market capitalization has corrected 3.5% so far this week, trading at $2,280 on Friday.
If BTC finds support near the previous broken weekly support at $2,184 and resumes its recovery, it could extend its rally towards the 200-week exponential moving average (EMA) at $2,547.
The Relative Strength Index (RSI) on the weekly chart is at 43, indicating an upward move towards the neutral 50 level after recovering from oversold territory, suggesting bearish momentum is fading. The Moving Average Convergence Divergence (MACD) indicator on the same chart shows a bullish crossover in mid-April that is still holding, and the rising green histogram bar confirms the bullish theory.
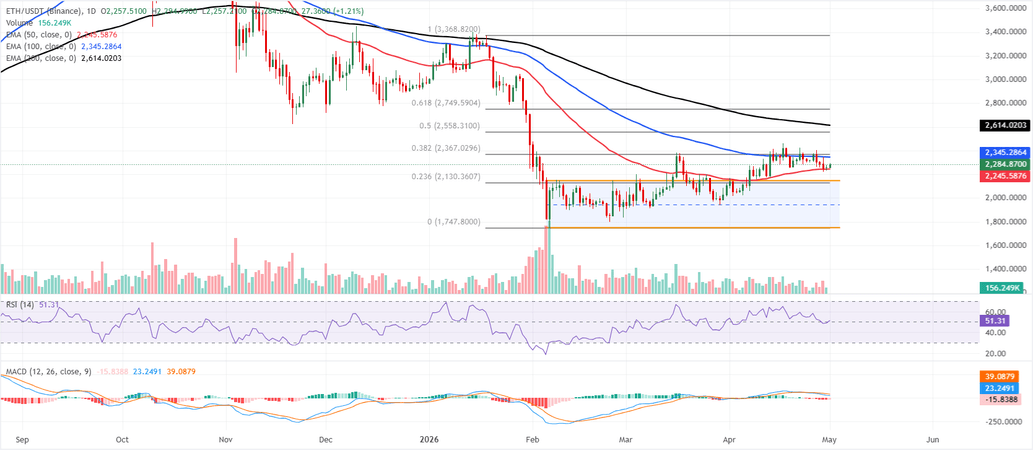
On the daily chart, Ethereum is trading just above the 50-day EMA of $2,245, but still well below the 100-day EMA of $2,345 and the 38.2% Fibonacci retracement (subtracted from January high to February low) of $2,367. This configuration suggests a neutral to slightly capped tone within a broader horizontal parallel channel as price trades above the previous channel high of $2,148, but lacks the strength to challenge the higher retracement band.
Momentum is mixed, with the RSI on the daily chart hovering around a neutral 50, while the MACD remains negative, suggesting weakening upside pressure despite holding near-term EMA support.
On the downside, initial support is found at the 50-day EMA near $2,245, with additional protection from the previous channel ceiling at $2,148 and the 23.6% Fibonacci retracement at $2,130, and an a break below this cluster would expose the channel base near $1,747.
On the upside, the bulls face the first major hurdle at the 100-day EMA at $2,345, followed by the 38.2% retracement at $2,367. A sustained rise above these barriers would pave the way for the 50% retracement at $2,558 and further to the 200-day EMA at $2,614, with the 61.8% retracement level at $2,749 a more distant target.
(The technical analysis in this story was written with the help of AI tools.)