

Critics will argue that the three previous cases are not enough to draw a clear conclusion. While that is true, the contrarian record of bearish crosses is consistent with the reputation of ultra-long moving averages as being “lagging” indicators.
backwards
Consider the information that the average value conveys. These represent average prices over the past 50 and 100 weeks. In other words, it reflects price action that has already materialized. The impending bear cross essentially reflects the 50% drop in Bitcoin price from $126,000 in October to nearly $60,000. At best, it has limited predictive ability.
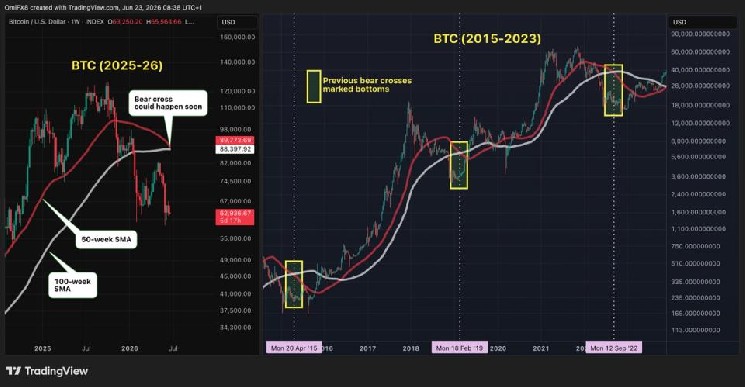
By the time these bear crosses finally occur, the market bubble has usually disappeared, short-term speculators have retreated, and capitulation has already occurred. Taken together, this suggests that traders are likely to treat this intersection as a significant signal that could indicate another bottom.
Of course, past patterns are no guarantee of future results, and changes in the broader economy can independently drive technological trends. As such, factors such as bond yields, ETF flows, and the latest behavior in strategies (MSTR) remain as important as ever in determining Bitcoin’s next move.
As of this writing, Bitcoin is trading near $62,400, with a 50-week average of $89,771 and a 100-week average of $88,397.