


Bitcoin’s quiet price movement may be masking increased market activity, as we’re seeing an unusual spike in trading volumes across spot and derivatives exchanges.
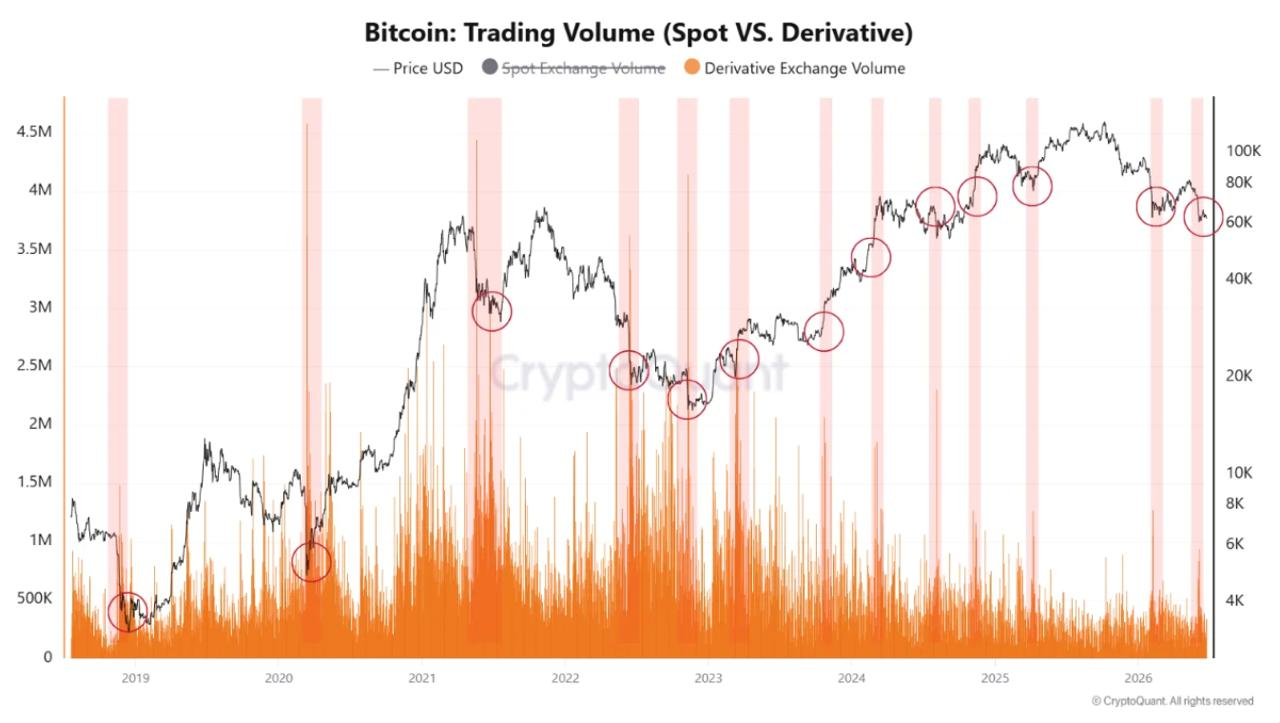
The chart, using CryptoQuant data shared by Coin Bureau, compares Bitcoin price and trading volume from 2018 to 2026. Some of the periods highlighted show sharp increases in activity while BTC is either solid or nearing important turning points.
This pattern does not predict whether Bitcoin will go up or down. Nevertheless, it suggests that large traders may be taking positions before volatility widens.
Derivatives trading volume frequently generates warning signals
Derivatives charts show repeated spikes in futures and perpetual contract activity across major Bitcoin cycles.
Significant volume increases were seen around the market bottom in 2018, the recovery period in 2020, the correction period in 2021, and several turning points from 2022 to 2025. A similar movement was seen during the recent price decline in 2026.
sauce: ×
In the derivatives market, traders can use leverage to establish both long and short positions. As a result, a sudden increase in trading volume may reflect active speculation, hedging, clearing, or institutional risk management.
In particular, derivatives spikes appear more frequently than spot surges. Therefore, it can be useful for early warning that positioning is changing, but it can also generate false signals if the price remains within the existing range.
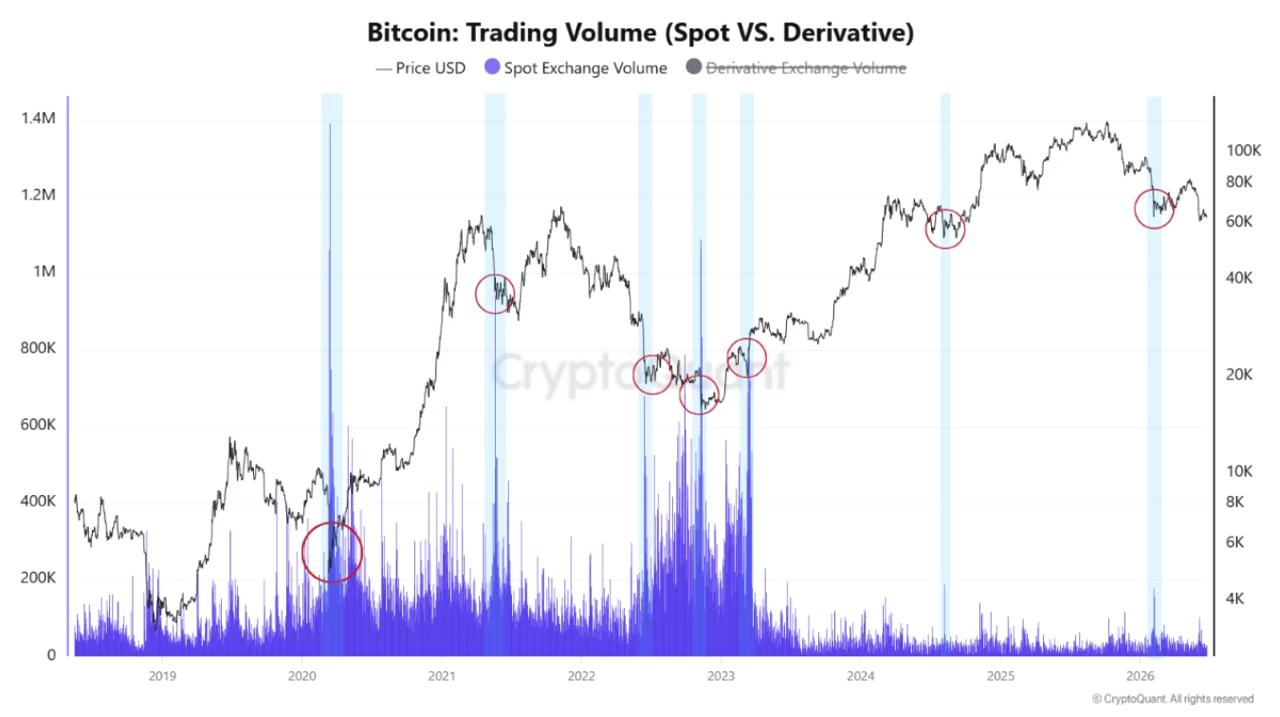
Spot volume provides a different view of the market
Spot charts measure direct buying and selling of Bitcoin, not leveraged contracts. Its largest spikes are less common, but some coincide with major periods of market stress or accumulation.
Substantial spot activity appeared around the March 2020 crash, the 2021 correction, the 2022 bear market, and the subsequent recovery phase. Another visible increase occurred near Bitcoin’s recent 2026 decline.
sauce:×
Spot volume can indicate that genuine coins are being traded among market participants. Heavy selling could indicate capitulation, while strong buying could indicate accumulation at a discount.
However, volume must be evaluated along with price. The sharp rise and subsequent rapid recovery may indicate that buyers absorbed the available supply. In contrast, an increase in trading volume during support breaks can confirm that sellers maintain control.
Bitcoin range attracts attention to the next break
Recent chart readings have Bitcoin sitting near the bottom of its 2026 trading range after falling from levels above $100,000. The price has stabilized around $60,000 to $70,000 and has started multiple bounces.
Smart money often leaves clues through abnormal volume before Bitcoin makes big moves. Therefore, the latest surge is most important while prices remain compressed and traders lack a clear directional trend.
A break above the nearby resistance with strong spot volume would support the recovery scenario. A renewed sell-off below established support, especially due to increased derivatives activity, could trigger liquidations and widen the decline.
At the moment, the chart shows increased activity with relatively calm price movements. Although Bitcoin has not confirmed its next direction, the unusual amount of retrieval suggests that the current range may not be sustained for long.