


Traders usually do not rely on a single indicator to determine market trends. However, this particular MACD proved reliable as a standalone indicator throughout the price crash from its all-time high of $126,000. While negative crossovers since October certainly signal the beginning of a significant decline, positive crossovers have preceded any meaningful rebound recovery, including the December-January rebound and the February-May rebound.
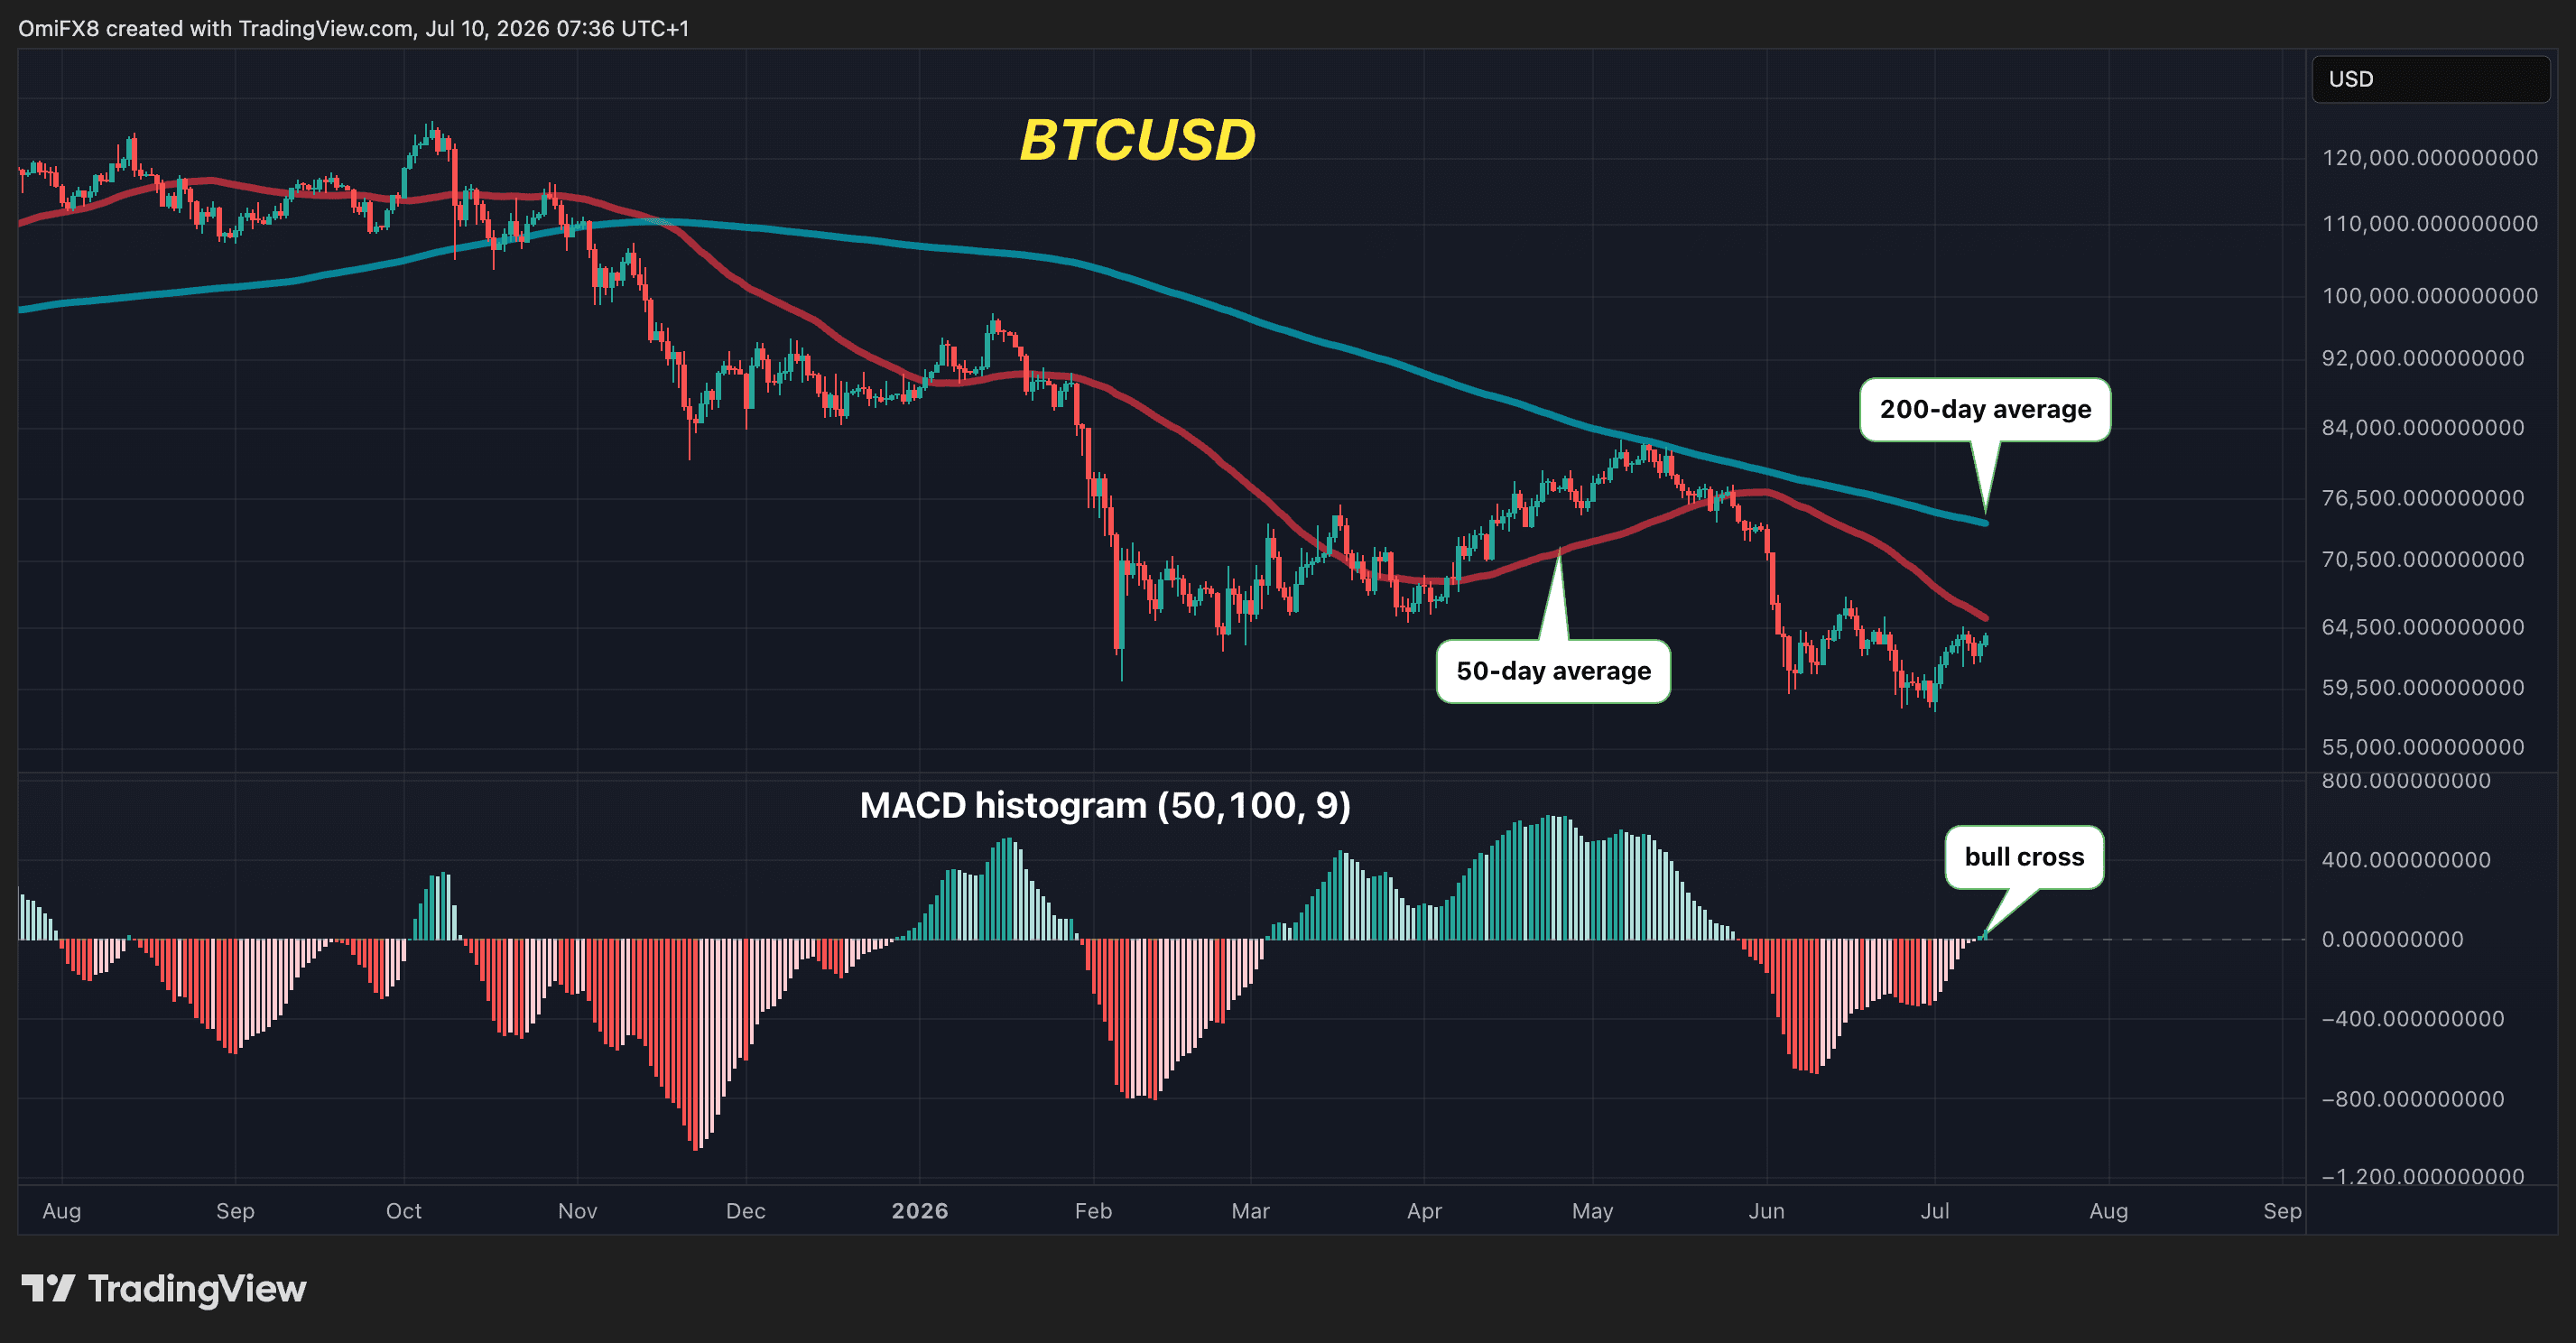
So, while the latest bullish crossover is not necessarily the start of a full-fledged new uptrend, it does signal a notable rebound to come. As this larger move requires further confirmation, the focus is now on the following key resistance levels:
Future important levels
The first level to look at is the 50-day simple moving average, currently sitting at around $65,434. This is simply the average Bitcoin price over the past 50 days (approximately 2 months).
Traders in both crypto and traditional markets closely monitor this line to gauge short-term momentum. A clear move above this is often seen as a sign of increasing upside power.
The second important level is $67,292, which is the mid-June high. Here, Bitcoin made a brief recovery from lows near $60,000 in early June, only for sellers to intervene aggressively. This resistance caused prices to fall again. A breakout of $67,292 would be another win for buyers, indicating that the price has overcome an area of strong selling pressure.


