


CryptoQuant’s latest data from April 30 shows that perpetual futures are driving Bitcoin’s recovery while spot demand is still contracting. This is the same market structure seen during the 2022 bear market rebound, where a leverage-driven rally gave way to new downside.
Spot purchases through exchanges, ETFs, or direct on-chain accumulation represent committed capital. At the same time, perpetual futures allow traders to take directional exposure using borrowed capital, often at multiples of the collateral, without holding the underlying asset.
When both forms of demand grow simultaneously, the rise tends to be self-reinforcing. If futures lead and there is a spot lag, leveraged traders will be able to fund the rebound and face a forced exit if the price moves against the futures.
2022 comparison
Several bear market rallies in 2022 have seen the same pattern, with perpetual futures demand recovering before spot demand recovered. Prices rallied and leveraged positions were stripped out as spot buyers proved too thin to absorb the selling.
The bounces appeared to be constructive, but each resolved into the next leg.
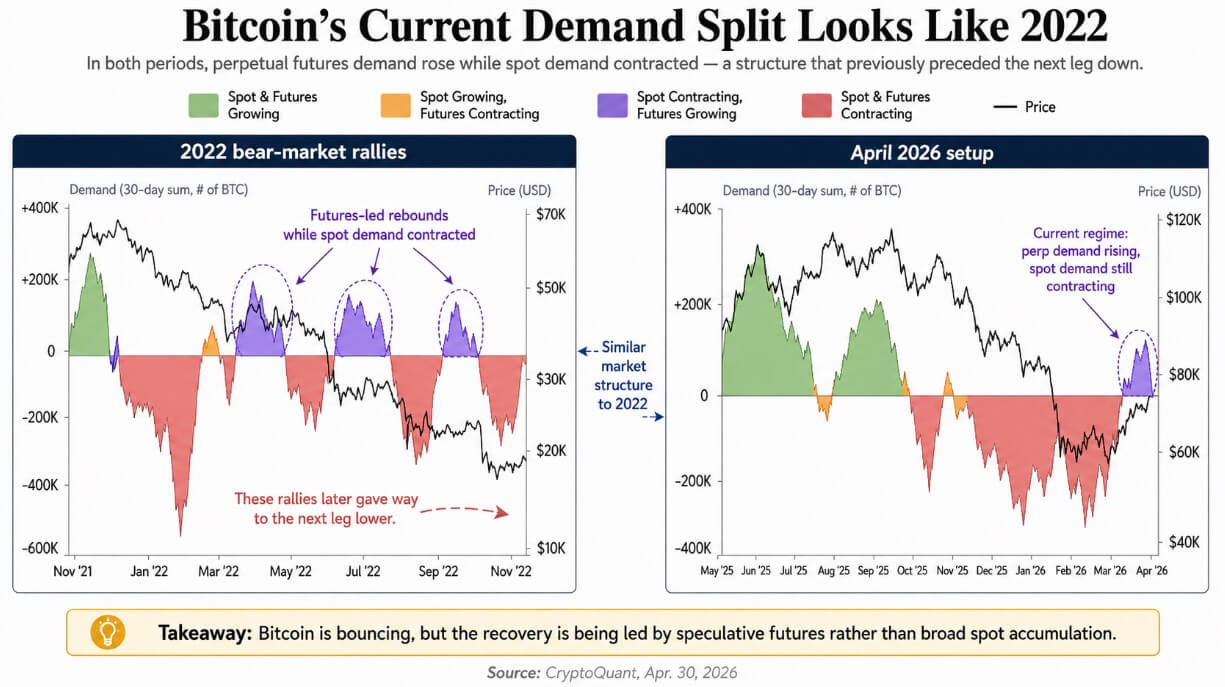
According to CryptoQuant’s chart, Bitcoin will return to its current regime in April 2026, where spot contracts are shrinking and futures contracts are expanding. Similarly, borrowed capital is re-emerging before real cash demand emerges, which is exactly the condition that made the failed 2022 rally so fragile.
The size of today’s futures markets makes their vulnerability a bigger variable. According to CoinGlass data, the 24-hour Bitcoin futures trading volume was $47.64 billion, compared to spot trading volume of $4.07 billion, a ratio of approximately 11.7 times, and open interest as of April 30th was approximately $54.19 billion.
Perpetual futures can involve borrowed capital of up to 50 times the collateral on some platforms, so relatively small price movements can trigger large-scale liquidations.
The depth of the market is rapidly tested as spot volume reaches $4 billion per day and long-side flushes begin.
What ETF data adds
The flow of US spot Bitcoin ETFs has recently raised alarm over the market structure, with data from Pharcyde Investors showing cumulative outflows of $490.5 million from April 27 to April 29.
The long-term ETF picture is holding its shape, but the ETF’s bid price has become volatile at the exact moment that futures positions are expanding.
| metric | current reading | why is it important |
|---|---|---|
| BTC futures volume, 24 hours | $47.6 billion | Derivatives activity dominates the market |
| BTC spot volume, 24 hours | $4.07 billion | Spot support is much smaller than futures trading |
| Futures/Cash Volume Ratio | 11.7 times | Shows that the rally is significantly leverage-driven |
| BTC open interest | $541.9 billion | Large leverage position base that can be unwound |
| US Spot BTC ETF Flows, April 27-29 | -$490.5 million | ETF demand has been unstable recently. |
| IBIT cumulative net inflow | ~$65.2 billion | Long-term institutional investor demand remains strong |
| Total cumulative inflows of US spot BTC ETF | ~$58.1 billion | Structural ETF bidding remains overall positive |
IBIT alone accounted for approximately $65.2 billion in cumulative net inflows, bringing the total for the entire U.S. Spot Bitcoin ETF category to approximately $58.1 billion, a number that reflects true structural buying that will not be present in 2022.
From April 13 to April 29, IBIT still absorbed net inflows of approximately $1.47 billion, maintaining long-term institutional conditions. The short-term view is that ETF bids currently do not provide clear price support at a time when futures positioning is most needed.
bull incident
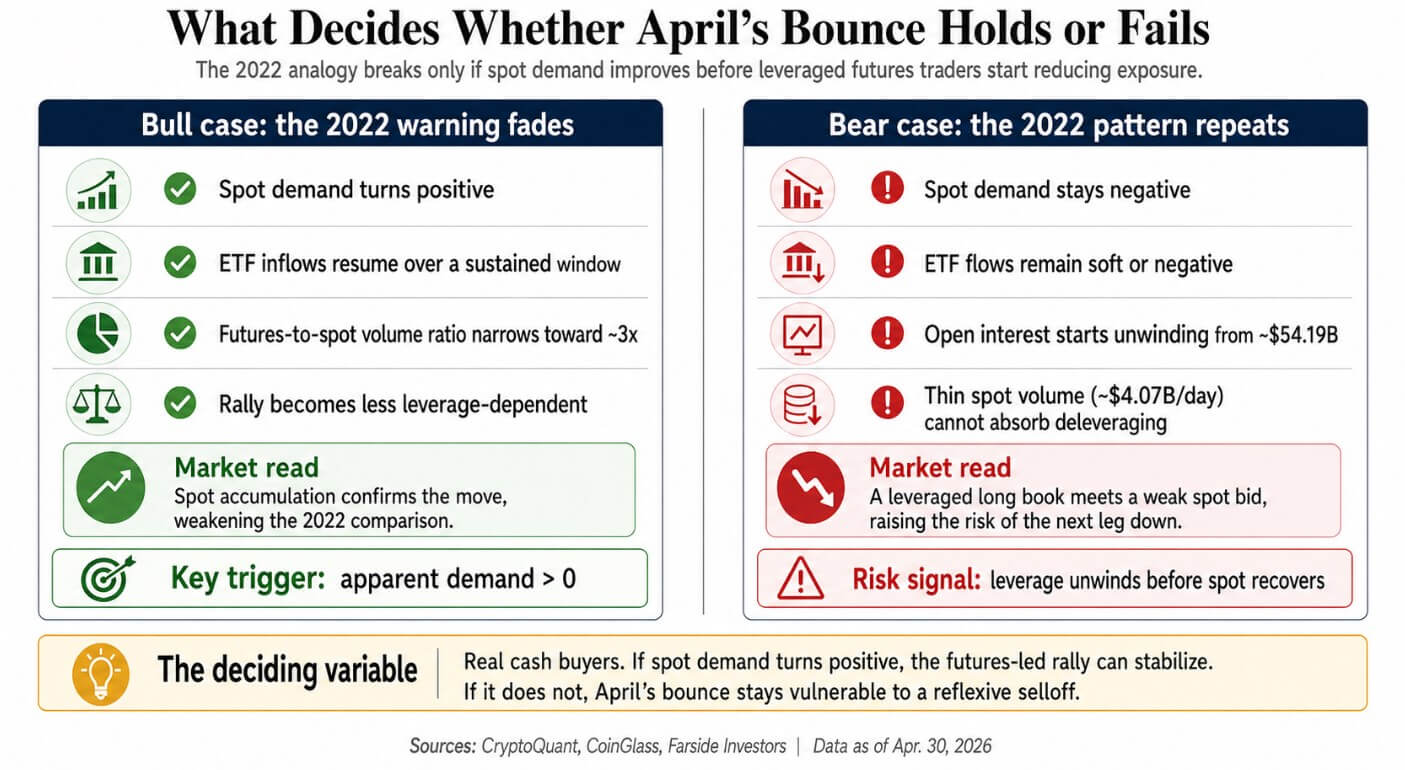
The 2022 analogy breaks down when spot demand turns positive before leveraged traders start reducing their exposure. A move in CryptoQuant’s apparent demand metric above zero is the cleanest invalidation trigger that spot accumulation confirms a futures-driven move.
The structural gap between 2026 and 2022 also provides basis for the bullish case. Bitcoin now regulates spot ETFs in the US, deeper institutional infrastructure, and sustained corporate financial bidding that didn’t exist four years ago.
CryptoQuant’s April 1 memo, which warned of a significant contraction in spot demand, also acknowledged that ETF and corporate buying was accelerating.
A bullish case is executed by buyers scaling up fast enough to bring spot demand back into positive territory. If ETF inflows resume for a sustained period of time and the futures-to-spot volume ratio narrows toward 3x the overall market, the market structure argument will itself weaken.
bear incident
In a bearish case, only leveraged traders should reduce their exposure before spot demand turns positive. All that is required is for leveraged traders to start reducing their exposure before spot demand becomes positive.
With open interest reaching $54 billion, even a partial unwind would result in a large absolute selloff, and with spot trading volume of approximately $4 billion per day, the market does not have the depth to absorb a rapid unwind without significant price declines.
This reflexivity further exacerbates the risk, as falling prices drive leveraged longs towards liquidations, liquidations drive prices down, and the cycle automatically progresses until spot demand is deep enough to maintain the floor.
The bear market ends when demand for both spot and futures recovers.
With the current setup, futures are recovering on their own, and if those conditions hold, Bitcoin will have recreated the demand structure of the failed 2022 rally. The tone of apparent on-chain demand and ETF flows in the coming weeks will determine whether the April rebound joins or leaves that list.
Either physical buyers step in and validate futures-driven moves, or the market learns what a leveraged long book looks like when spot bids are too thin to sustain the floor.
(Tag to translate) Bitcoin