


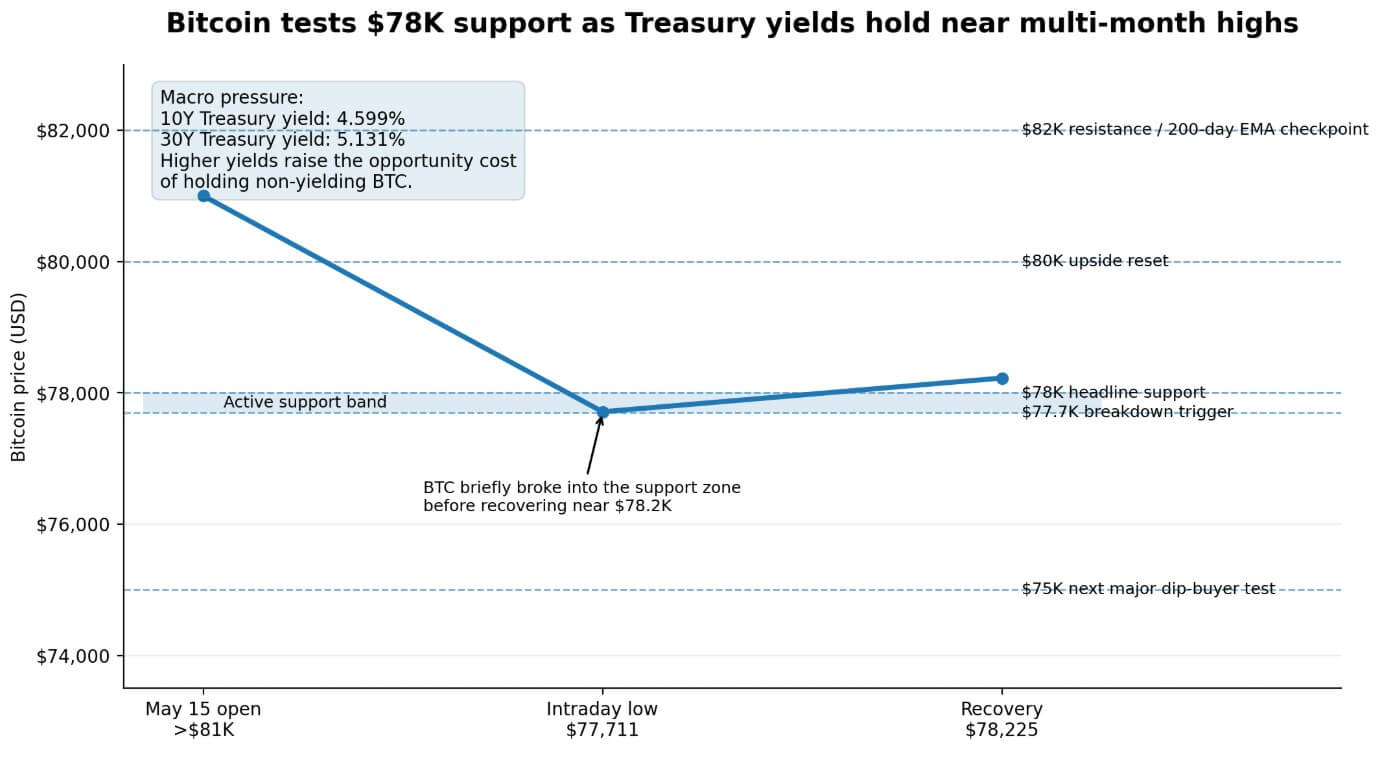
Bitcoin hit $77,711 during the day before recovering to near $78,225, continuing to trade under macro stress for a second straight day as U.S. Treasury yields hover near multi-month highs.
The 10-year yield hit 4.599%, and the 30-year yield rose 11.8 basis points to 5.131%, its highest level since May 2025. Bitcoin is down 3.9% from its opening price of over $81,000 on May 15, with stocks and bonds also falling in a similar manner.
The $77,700-$78,000 zone, which was already the next support shelf when BTC fell below $82,000, is now carrying the full weight of its macro test.
macro weight
As a non-yielding asset, BTC currently competes directly with the Treasury complex, which pays 4.5% to 5.1%, and that level of interest rate floor increases the opportunity cost of holding BTC.
According to K33 data, the 30-day correlation between Bitcoin and Nasdaq futures is above 0.7, meaning that Bitcoin’s beta relative to equity drawdowns tends to rise when the Nasdaq sells off heavily.
Both channels are active in the current decline, and the macro backdrop leaves the Fed with little room to ease either channel. CPI rose 3.8% year-on-year in April, accelerating from 3.3% in March, while core CPI remained at 2.8% and the energy index rose 17.9% over the past 12 months.
WTI settled at $105.42 on May 15, up 4.2% on the day and 11.33% for the month, while Brent rose 3.35% to $109.26.
Trading Economics models Brent at $111.28 by the end of the quarter, while HSBC has raised its 2026 Brent forecast to $95, while modeling average Brent at $110 if supply contracts are in place towards the end of the summer.
According to data from the University of Michigan, year-on-year inflation expectations were at 4.5% in May, while the Fed’s April FOMC statement promised to assess inflation before easing, leaving the hurdles for policy easing high.
CoinShares reported $706.1 million in inflows into its Bitcoin investment products for the week ending May 11, suggesting strong institutional bids.
Since then, the bid has deteriorated to an outflow of $630.4 million on May 13, an inflow of $131.3 million on May 14, and an outflow of $290.4 million on May 15, according to daily U.S. spot Bitcoin ETF data from Pharcyde Investors.
This 2-of-3 outflow sequence removed the ETF’s buffer from the $78,000 support test at a time when it needed protection, the same buffer that absorbed macro headwinds in the early weeks.
support map
The intraday low of $77,716.09 places BTC directly within the support zone, and a daily close above $78,000 would technically cap a correction.
A decisive loss at $77,700 is the beginning of the next downside sequence, with $76,500 being the first follow-through target and the bears confirming the break, followed by $75,000 being the round number zone where bullish buyers historically need to show confidence.
Further extension would see $73,000 to $74,000, a range reconfigured as macro-driven deleveraging across risk assets.
| BTC level | role | Reason for viewing | Market impact |
|---|---|---|---|
| $82,000 | Big upper resistance line / 200-day EMA checkpoint | Daily closing price is over $82,000 | Reframe the $78,000 test as a failure breakdown, giving you more room for the low $80,000s. |
| $80,000 | First upside reset level | BTC recovers $80,000 at daily closing price | Weakening the bearish follow-through from the two-day decline and setting up a retest of $82,000. |
| $78,000 | Heading support | Daily closing price is over $78,000 | Technically contain modifications and maintain a controlled pullback narrative. |
| $77,700 | breakdown trigger | Definitive closing price below $77,700 | Confirm support failure and shift focus from stabilization to continuation on the downside. |
| $76,500 | first downside target | BTC loses $77,700, sellers continue | Marks the first bear confirmation zone after the $78,000 shelf cracks. |
| $75,000 | Round number dip buyer test | Pressure below $76,500 continues | Tests whether push buyers and long-term holders can absorb supply with confidence. |
| $74,000 – $73,000 | Deeper macrodeleveraging zone | BTC is unstable around $75,000 | We reframe this movement as a broad macro-driven drawdown across risk assets. |
Recovering $80,000 is the first step to neutralizing the bearish setup. That’s because the daily close breaks the low-to-low sequence from the past two sessions, giving the bulls a technically clean reset.
The more difficult challenge is $82,000, and as of May 13th, BTC is trading below the 200-day exponential moving average around that level, which serves as the upper bound of the round number as well as a technical checkpoint. If the close exceeds $82,000, the $78,000 test will be reconfigured as a failed breakdown.
What the market can expect
Bitcoin could regain $80,000 if the 10-year Treasury yield falls below 4.50%, oil prices cool from their current levels above $105 per barrel, and ETF flows turn positive.
This recovery breaks the low-to-low sequence of the past two sessions and sets up a retest of the $82,000 200-day EMA level that BTC ended below on May 13th.
If the day closes above $82,000, the yield-driven pullback will fail, leaving room for the high $80,000s and reframing the past week as a corrective shakeout with fundamental accumulation theory intact.
| scenario | BTC trigger | macro condition | ETF flow signals | Expected price path | Article structure |
|---|---|---|---|---|---|
| bull reset | BTC collection $80,000close on $82,000 | 10-year bond yield falls below 4.50% and the oil is cooled from above $105/barrel | Spot BTC ETF flow reverses and turns positive | retest of $82,000then likely to rise towards the low $80,000s | A decline will result in a failed breakdown and a corrective shakeout. |
| controlled correction | BTC maintains around the closing price every day $77,700 – $78,000 | Yields are still rising, but they have stopped rising aggressively | ETF flows are mixed, but outflows are not accelerating | choppy range between $78,000 and $80,000 | Corrections will remain subdued as markets wait for macro stabilization. |
| Bear breakdown | BTC will definitely close below $77,700 | 10-year bond yield almost unchanged 4.60% Inflation/hydraulic persists | ETF outflows continue | drop towards $76,500after that $75,000 | The support test fails and the market begins to price in a deeper macro-driven rebound. |
| stress relief | bitcoin loses $75,000 and cannot attract high-sale buyers. | Long-term yields are hovering near multi-month highs. Oil and inflation expectations remain high | ETF outflows become more serious or persist | move to $74,000 – $73,000 | The conversation moves from normal corrections to deleveraging between assets. |
If BTC closes below $77,700 with US Treasury yields remaining near 4.60% and ETF outflows continuing, the support test will confirm a failure.
The support at $76,500 is the first downside objective, with the bears confirming the break and a correction entering new lows. The next level to look at is $75,000, the round number zone where push buyers have historically needed to absorb supply with confidence.
A sustained move below $75,000 will push BTC towards the $74,000-$73,000 zone. This range reframes the correction as a macro-driven deleveraging, with price realignments across assets impacting stocks and bonds, which will also spill over into BTC.
Macro inputs that drive Bitcoin’s near-term direction need to stabilize before a recovery anchor forms.
The 10-year is 4.599% and the 30-year is 5.131%, offering holders an income floor of 4.5% to 5.1%. Bitcoin sits below its floor in carry given its non-yielding status.
With inflation expectations next year at 4.5% and the Fed still assessing the situation before transitioning, rapid policy easing is far from realistic pricing in the market.
The $78,000 zone involves a structural test of whether buyers and long-term holders of the ETF can absorb the cost of changing interest rates fast enough to stabilize prices before the support shelf collapses.
(Tag translation) Bitcoin