


Bitcoin regained $65,000 after oil prices fell to a two-month low following reports of a peace deal between the US and Iran that eased fears of disruption in the Strait of Hormuz.
According to data from crypto.news, Bitcoin ($BTC) rose to an intraday high of around $65,995 on June 15th, extending the rebound from the June 6th low of around $60,000. Although this move represents an increase of about 10%, Bitcoin remains about 21% below the local high of around $82,800 reached in May before the sharp selloff in early June.
Bitcoin’s rally today came as risk assets rose across global markets following reports that the US and Iranian governments have reached an agreement to end hostilities and restart oil shipments through the Persian Gulf. Oil prices fell more than 5% to around $80 per barrel, and stock markets across Asia rose.
Japan’s Nikkei Stock Average rose 5.5%, South Korea’s Kospi rose as much as 5.7%, Taiwan’s Tyex rose 2.7% and Australia’s ASX200 rose about 1.5%. U.S. stock futures also rose, with S&P 500 and Nasdaq futures up about 1% and 1.8%, respectively.
The fall in energy prices has reduced one of the biggest macro risks hanging over financial markets in recent months. The prolonged blockage of the Strait of Hormuz has spilled millions of barrels of oil from global supply chains, heightened inflation concerns and raised questions about how aggressively the Federal Reserve needs to respond.
Bitcoin is also seeing progress as derivatives traders return to the market. Bitcoin open interest increased to approximately $46.13 billion, and the weighted funding rate remained slightly positive at 0.0029%, according to CoinGlass data. This combination suggests traders are adding exposure without the excessive leverage often seen near local tops.
Bitcoin faces major resistance between $67,500 and $75,000
On the technical side, Bitcoin broke through the $64,500 resistance area highlighted by several market analysts over the weekend. The 4-hour chart shows: $BTC Confirm the breakout from the ascending triangle. It is a bullish continuation pattern characterized by rising lows pushing against a horizontal resistance zone. This move pushed Bitcoin above the 20-period and 50-period moving averages.
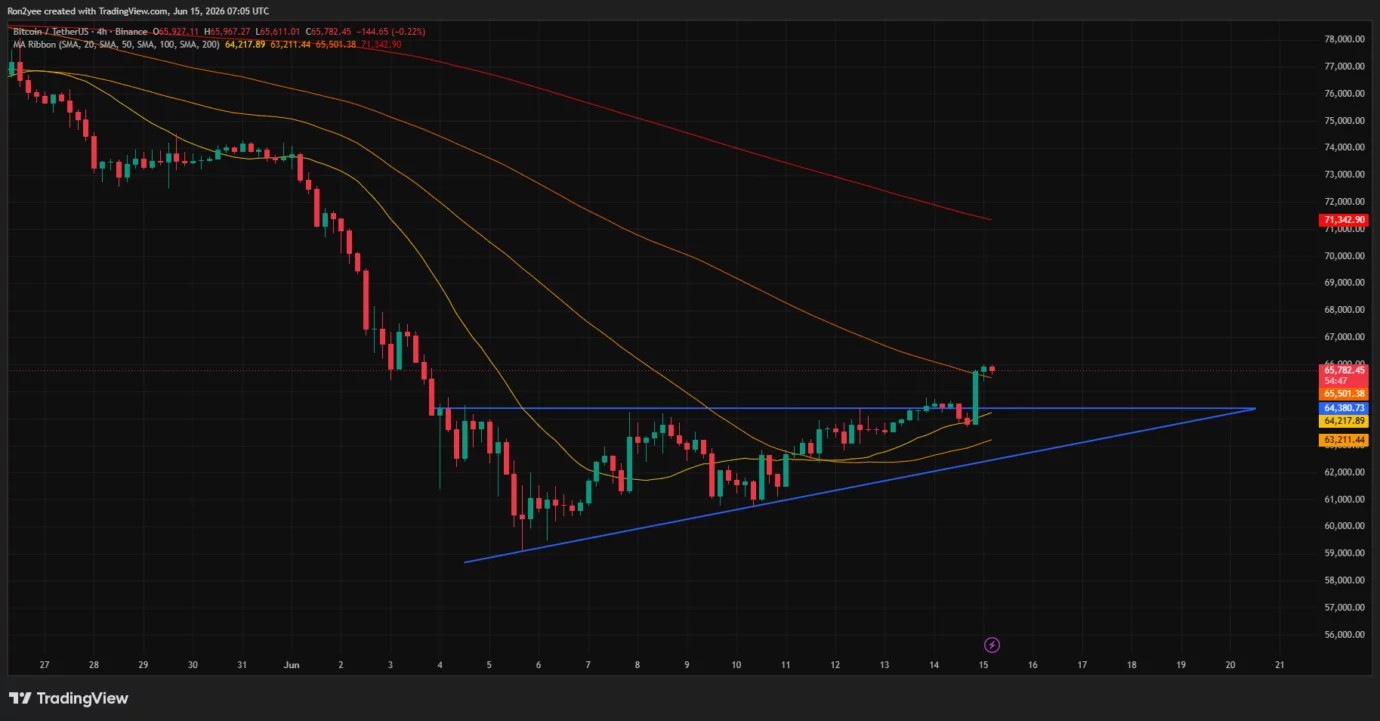
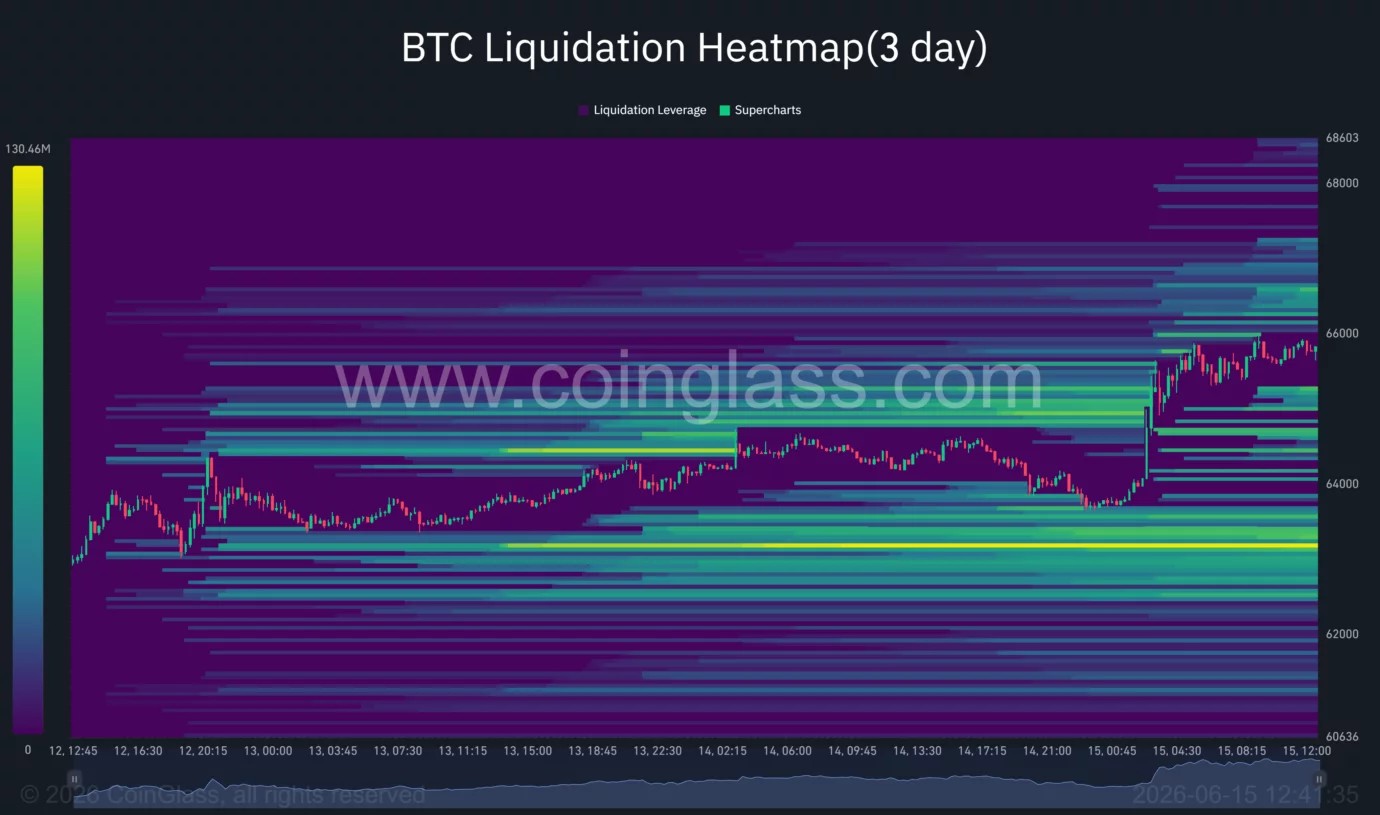
The next major resistance level is near $67,500, a level consistent with a large liquidation cluster that can be seen on CoinGlass’ three-day heatmap.
Analyst Camille Ouray says the outlook for Bitcoin remains positive as long as the recent breakout continues.
“$BTC They overcame the resistance of 64,500 people with their volume. As long as the bottom of 63,707 remains, the rally is likely to continue. ”
Uray cited $67,500 as the first major hurdle. A successful breakout of this level could pave the way to the $74,000-$75,000 area, which coincides with the 0.236 Fibonacci retracement level on the daily chart.
The analyst also cited $82,885 as the level at which concessions would need to be made before a move to $98,000 becomes realistic.
The daily chart shows Bitcoin retaking the 0.786 Fibonacci retracement level near $64,220 before entering a major resistance area between $65,500 and $67,500. A definitive pullout above this zone would strengthen the possibility of heading into the $74,000-$75,000 region.
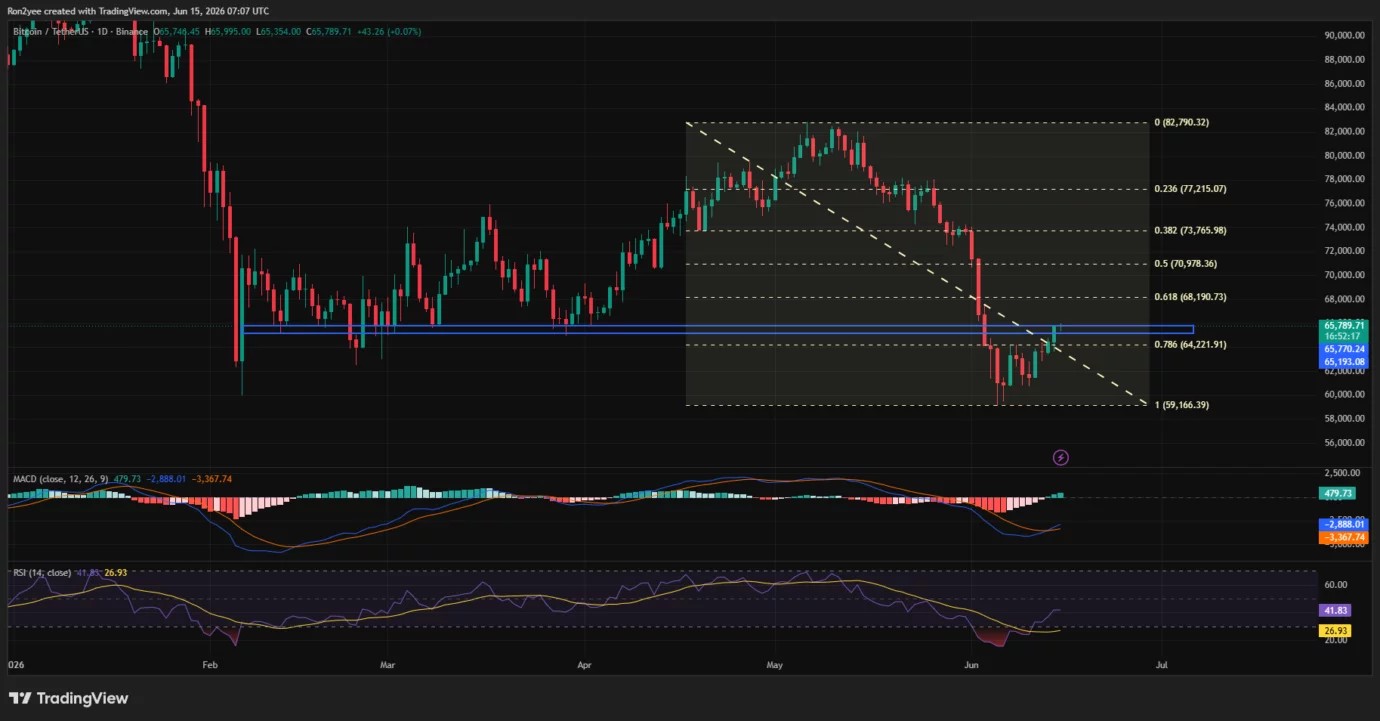
The daily RSI has recovered from oversold territory to above 40, and the MACD histogram has entered positive territory for the first time in weeks.
Liquidation data highlights another important factor. CoinGlass’ heatmap shows a cluster of short-term liquidation pockets concentrated between $67,000 and $68,500. Once Bitcoin reaches these levels, forced short covering could accelerate the rally and create further upward momentum.
Downside risk continues due to sluggish ETF demand
Despite the recovery, concerns remain about institutional participation. The US Spot Bitcoin ETF has recorded just two days of net inflows since May 15, but has accumulated about $5 billion in net outflows over the same period.
These funds were a huge catalyst for Bitcoin last year, helping push the asset to an all-time high of over $126,000 in October 2025. If demand for ETFs continues to slump, it will remove one of the strongest buying sources from institutional investors that has supported the bull market thus far.
Some traders remain skeptical that the rally signals the beginning of a sustained recovery. Commenting on the recent rally, market analyst Crypto Barrett believes the current recovery is nothing more than a “little dead cat rally” and argued that Bitcoin could fall further.
$BTC much lower
Enjoy this little dead cat bounce while it lasts and brace yourself for more downside 📉 pic.twitter.com/eiVZTcGiNv
— CryptoBullet (@CryptoBullet1) June 14, 2026
In technical analysis, a dead cat bounce refers to a temporary recovery during a broader downtrend in which the price rebounds sharply before resuming its decline and falling to new lows.
The bearish case gains momentum once Bitcoin loses the breakout zone between $63,700 and $64,500. Heatmap data shows significant liquidity around $63,000, but a deeper decline could expose the psychologically important $60,000 level.
Urai cited $60,000 as a key level that bulls must protect to avoid opening the door to a fall into the $55,000-$50,000 range.