


Bitcoin has entered a bearish channel after falling below a key support level as ETF outflows, rising oil prices, and new geopolitical uncertainties weighed on market sentiment.
According to crypto.news data, Bitcoin ($BTC) was trading around $72,700 at press time, after briefly falling to around $72,600 in early Monday trading. It is down about 1.5% in the past 24 hours, 6% in the past week, and 10% from May highs near $81,000, pushing the cryptocurrency back around a key support zone that traders have been closely monitoring all year.
Amid the recent economic downturn, institutional demand has weakened significantly. The Spot Bitcoin ETF recorded net outflows of $1.42 billion over the past week, on top of more than $2.4 billion in withdrawals throughout May, according to SoSoValue data.
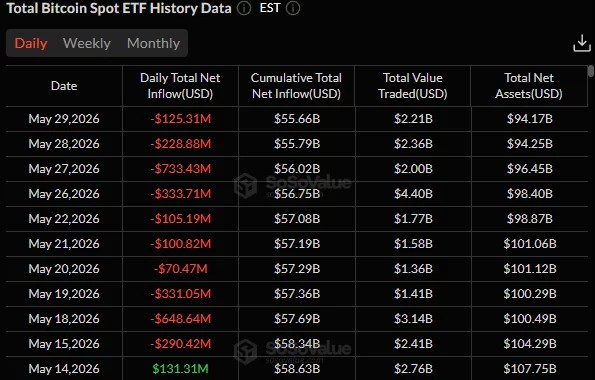
Continued redemptions have removed a major source of buying pressure, forcing ETF issuers to sell their underlying Bitcoin holdings into an already fragile market.
New geopolitical concerns added further uncertainty over the weekend. The US military said it attacked Iranian radar and drone facilities in the city of Gork and Qeshm Island after Iran allegedly shot down an American MQ-1 drone flying over international waters. According to US Central Command, the operation targeted an air defense system, a drone control station and two attack drones.
The military action comes as the U.S. and Iranian governments continue to exchange proposals to extend the ceasefire agreement and reopen the Strait of Hormuz. With no formal resolution announced, traders remained focused on the possibility of further disruption in one of the world’s most important energy corridors.
Oil markets reacted quickly. WTI crude oil futures rose nearly 4% above $90 a barrel, recouping some of last week’s losses as uncertainty clouded prospects for the deal’s permanence.
US President Donald Trump has also repeatedly called for Iran to halt its nuclear program and restore full unfettered access to the Strait of Hormuz.
Rising energy prices have renewed concerns that inflation may remain high for longer than previously expected. A prolonged rise in oil prices could complicate the U.S. Federal Reserve’s path to monetary easing, reduce the likelihood of short-term interest rate cuts, and create an unfavorable environment for speculative assets such as cryptocurrencies.
Market observers have reported that after Bitcoin’s rally earlier this year, spot distributions from whales increased and long-term holders booked profits. The combination of reduced inflows from institutional investors and profit-taking activity makes the market vulnerable to sharp downside movements whenever macroeconomic concerns rise.
Not all prominent Bitcoin supporters have become cautious. While Strategy magazine has hinted at more Bitcoin purchases, investor and author Robert Kiyosaki recently called on market participants to prioritize financial education rather than blindly following market narratives. Kiyosaki argued that even assets that have traditionally been considered safe investments can result in losses if purchased without proper timing or understanding.
Technical Structure Squeezes $72,000 Support
Bitcoin’s technical outlook has since deteriorated $BTC Prices broke below the downtrend line that had led to the highest decline since May. Looking at the daily chart, $BTC Trading within a bearish channel, sellers repeatedly defend recovery attempts before the asset regains a key resistance level.
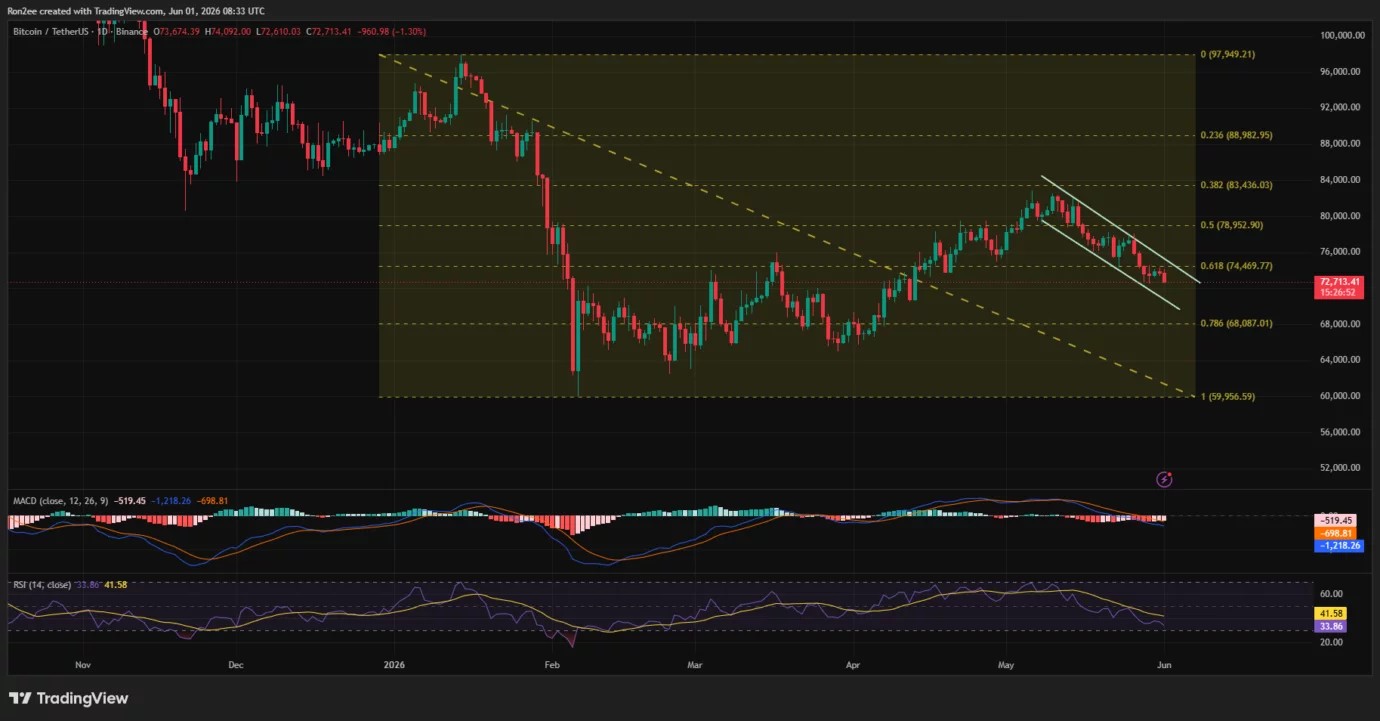
In the main Fibonacci retracement structure from January highs near $97,900 to February lows near $59,950, Bitcoin sits just below the 0.618 retracement level at approximately $74,470. Rejections from the zone during May reinforced the zone as an important area of resistance. The price is currently located between the 0.618 and 0.786 retracement levels, with the latter located around $68,100.
Momentum indicators continue to favor sellers. The daily MACD has entered negative territory, while the RSI has fallen towards 41, with momentum well below a neutral situation. Neither indicator shows any evidence of a bullish reversal at the moment.
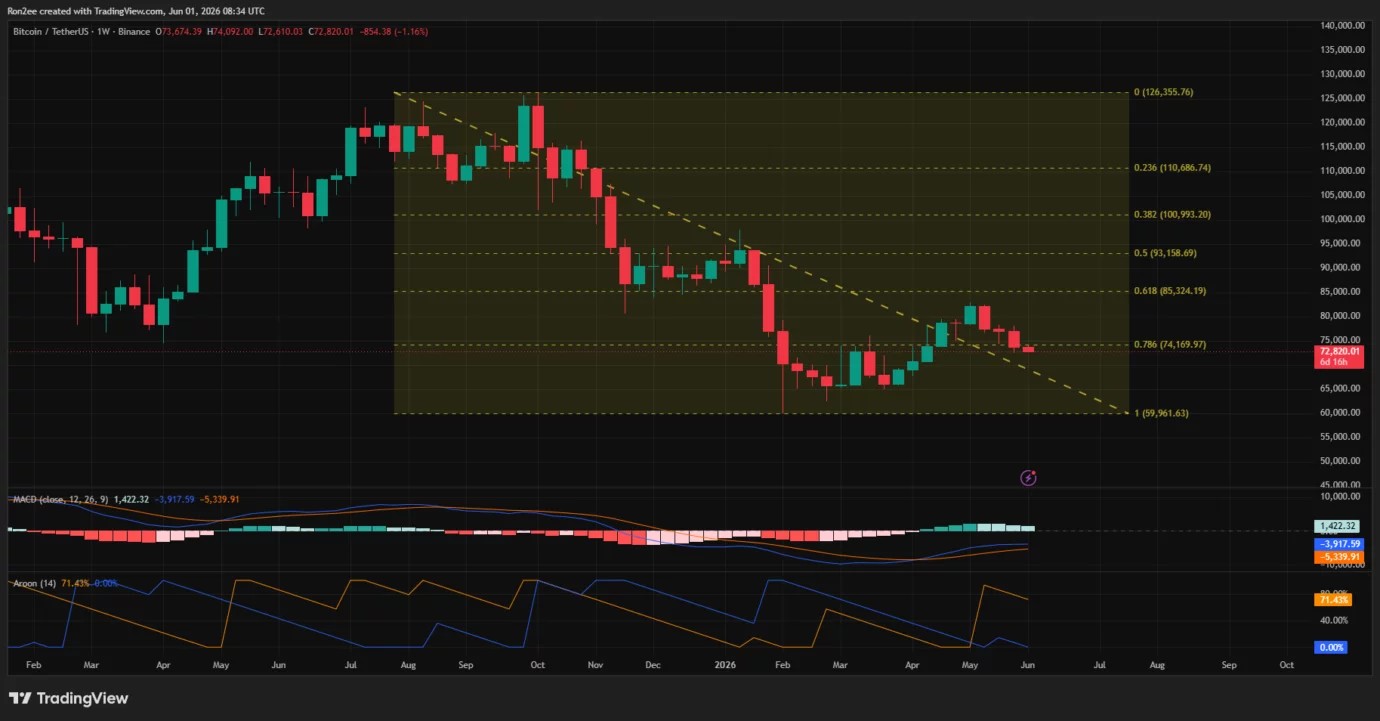
The weekly time frame shows a similar situation. Bitcoin has recently been unable to break above the 0.786 Fibonacci retracement level near $74,170 and is moving back toward support near $72,000. Aroon measurements continue to be heavily biased towards downward momentum, with the Aroon down indicator dominating the trend on higher time frames.
Derivative positioning signals the potential for increased volatility if support breaks. CoinGlass liquidation data shows that one of the largest leverage clusters is concentrated between $72,000 and $72,500. A large portion of the extended liquidation is now located directly below the price, creating conditions for another forced wave of selling if the support area breaks.
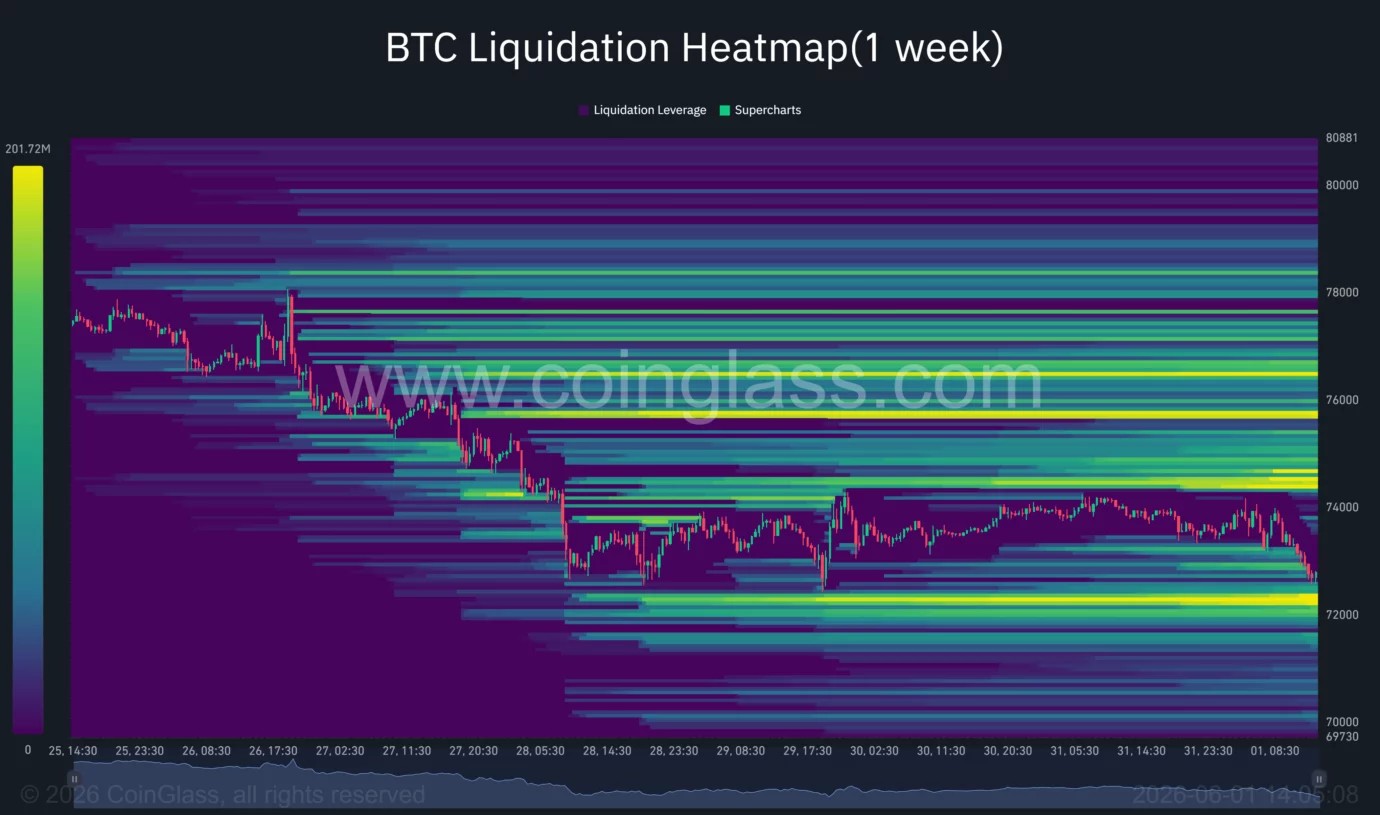
The liquidation heatmap also highlights a sizable short position between $74,500 and $76,000. Liquidity concentrations above current levels do not necessarily mean a trend reversal, but these levels could attract prices in the event of a bailout rebound.
According to crypto analyst Ali Martinez, Bitcoin is approaching the make-or-break support area around $72,650, which has historically attracted strong demand from investors.
“I am closely monitoring Bitcoin’s $72,650 as the MVRV pricing band continues to identify this as a key support level. If this fails, the next major demand zone will be located between $54,300 and $51,000.”
I am closely monitoring Bitcoin’s $72,650 $BTCas the MVRV price range continues to identify this as an important support level.
If that fails, the next major demand zone is between $54,300 and $51,000. https://t.co/wfcCrStSPU pic.twitter.com/eCXcHUtgOI
— Ali Charts (@alicharts) May 31, 2026
Analyst assessments are consistent with the weakening in market structure seen over higher time frames, with some previous support levels already converting into resistance.
Another market update from Team Lambo provided a more balanced view. The group noted that despite recent weakness, Bitcoin remains within a broad demand zone and emphasized that regaining resistance near $75,600 is critical to regaining bullish momentum.
Analysts say the peace deal confirmed between the United States and Iran could be the catalyst needed for any recovery attempt.
ETF demand and geopolitical developments remain key drivers of nullification
The most immediate risk to the bearish outlook remains a reversal in institutional capital flows. Bitcoin’s recent decline coincided with the largest ETF withdrawal in 2026. A return to sustained inflows could remove a major source of spot market selling and stabilize price action around current levels.
Sentiment can also change rapidly due to geopolitical developments. A formal agreement extending the ceasefire between the US and Iran while guaranteeing unrestricted shipping through the Strait of Hormuz could ease concerns in energy markets and improve demand for risk assets.
From a technical perspective, Bitcoin will need to regain the $74,500-$75,600 area to weaken the current bearish structure. A move above this area will push the price above the 0.618 Fibonacci retracement level, opening the door for a retest of the resistance near the $79,000 level.
However, failure to protect $72,000 could trigger a more aggressive liquidation event. The heatmap suggests that significant leverage positions remain below the current price, with the $68,000 area identified as the next major technical support on the daily chart. A break below that level could shift attention to the $54,000 to $51,000 demand zone highlighted by the MVRV pricing model.