


Bitcoin failed to regain the $82,800 resistance zone earlier this month and remains under increasing pressure. Latest fixes pushed $BTC Traders are currently watching for signs of stabilization towards the $75,000 area. At the same time, institutional investor sentiment weakened as BlackRock’s Spot Bitcoin ETF recorded another large outflow.
Bitcoin Remains Important Support as Momentum Fades
Bitcoin traded near $75,600 during Tuesday trading, still below key short-term moving averages. The asset continues to trade near the 20-day EMA of $77,800 and the 50-day EMA of $76,700. As a result, buyers are struggling to regain strong upside control.
The recent decline also boosted $BTC Heading into a major Fibonacci support cluster between $75,000 and $76,000. Traders are currently closely monitoring the 0.618 Fibonacci retracement level at $76,033. This zone could determine the next direction for Bitcoin.
Moreover, technical indicators are still showing mixed signals. The 200-day EMA near $81,400 remains the main resistance barrier for bulls.
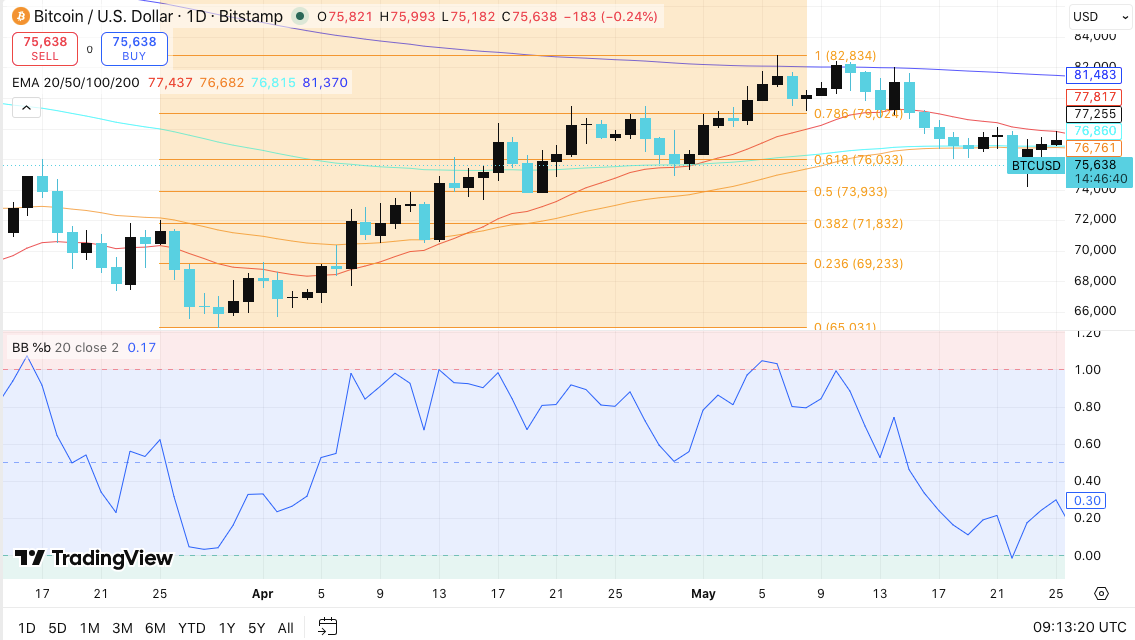
On the other hand, a Bollinger Band reading close to 0.30 suggests that an oversold situation could emerge soon. Therefore, if buyers defend the current support level, a short-term rebound remains possible.
On the upside, Bitcoin needs to regain $76,033 and $76,800 to improve short-term sentiment. A break above these levels could trigger a move towards $77,800 and ultimately $81,400. However, the broader structure remains dominated by sellers.
When bearish momentum becomes stronger, $BTC There is a possibility of a return to the $75,000 support level soon. Additional downside targets include $73,933 and $71,832.
Open interest and currency flows indicate cautious positioning
Despite the recent price decline, Bitcoin derivatives activity still reflects increased leverage. Open interest surged aggressively as Bitcoin rallied towards the $120,000 region earlier this year. The indicators then cooled sharply as the correction phase accelerated.
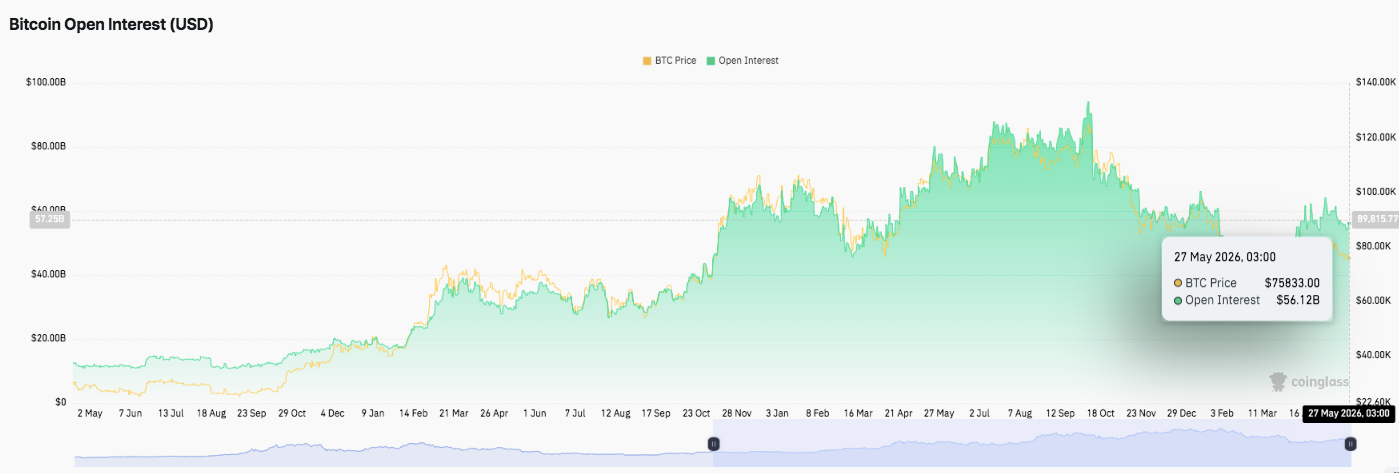
Open interest has recently declined towards the $56 billion region. This decline likely reflects a prolonged period of liquidation and reduced speculative exposure. However, although the metrics appear to be stable, $BTC It trades between $75,000 and $80,000. As a result, traders may cautiously restructure their positions around current levels.
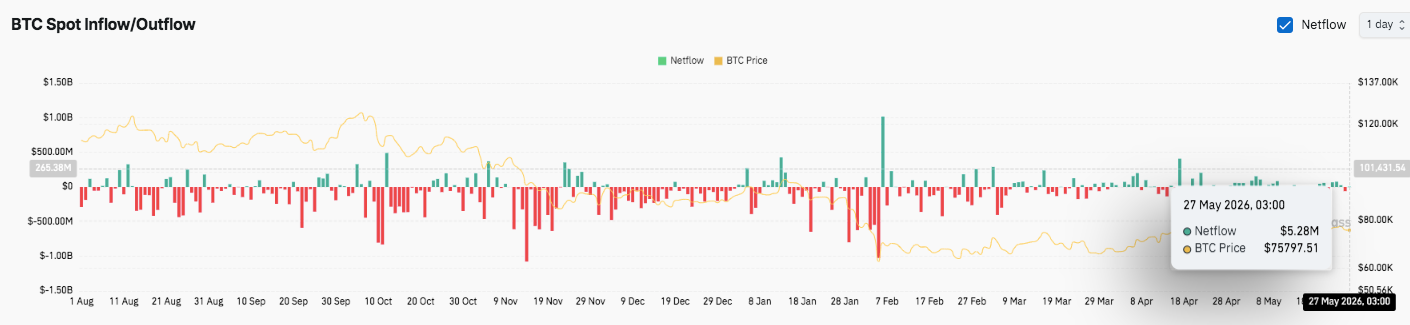
Additionally, exchange flow data continues to support long-term accumulation behavior. Large currency outflows dominated trading for several months, especially from October to February. These withdrawals often indicate that investors are moving their Bitcoin into cold storage.
However, the volatile months of February and April saw intermittent spikes in inflows. These movements suggested temporary profit-taking during sharp market fluctuations.
BlackRock ETF outflow adds pressure
Demand from institutional investors has also weakened recently. BlackRock’s IBIT recorded net outflows of approximately $192.3 million on May 26th. The fund has now recorded eight consecutive days of withdrawals.
The broader U.S. spot Bitcoin ETF market has lost more than $2 billion since May 14th. Importantly, May 18th saw $648.64 million outflows from the Spot Bitcoin ETF, making it the largest single-day outflow event.
Although the sector still manages more than $100 billion in assets, recent outflows reflect a short-term decline in confidence. As a result, Bitcoin could remain stuck in a consolidation phase until institutional demand picks up again.
Technical outlook for Bitcoin price
Key levels remain well-defined as Bitcoin trades within a short-term correction structure after being rejected near the $82,800 resistance zone.
Top level: $76,033 and $76,800 remain the primary resistance. A sustained breakout above these levels could pave the way to $81,400, a key resistance zone near $77,800 and the 200-day EMA.
Lower price level: $75,000 continues to serve as a major support floor, followed by $73,933 and $71,832 if bearish momentum accelerates.
Upper limit of resistance: $81,400 remains an important intermediate breakout level. Bulls need to reclaim this zone to regain stronger upward momentum and override the current consolidation structure.
The broader technical picture suggests that Bitcoin remains trapped in a cooling consolidation phase after a sharp rejection from the $82,000 area. Momentum indicators continue to soften, while Bollinger Band readings near oversold territory suggest a possible near-term rebound attempt. Meanwhile, open interest remains stable around $56 billion, indicating that traders are cautiously restructuring their exposure despite recent volatility.
Will Bitcoin go up?
Bitcoin price predictions for the coming weeks will largely depend on whether buyers can defend the $75,000 support cluster while reclaiming the short-term moving average. if $BTC If it regains strength above $76,800, the bullish momentum could accelerate towards $77,800 and eventually retest the $81,400 resistance ceiling.
Additionally, the dominance of currency outflows still supports the long-term accumulation narrative as many investors continue to move. $BTC To the cold storage. However, weakening institutional sentiment remains an immediate concern after BlackRock’s IBIT recorded eight consecutive days of capital outflows.
If overall market confidence improves as open interest increases, Bitcoin could quickly regain momentum. However, if you fail to keep the $75,000, you could be at risk. $BTC Deeper downside targets near $73,933 and $71,832.
For now, Bitcoin remains in a key technical zone, with both macro sentiment and institutional flows likely to determine the next big direction.


