


Ethereum price trend continues to compress within a well-defined range after a sharp decline at the beginning of the year, with traders concentrating on a definitive breakout. The daily chart shows that the market has calmed down from the aggressive selling pressure and is entering a more severe consolidation phase.
This change suggests a pause rather than a complete reversal. As a result, market participants are now closely monitoring key levels as volatility contracts and positioning build. While the broader structure remains in favor of caution, subtle shifts in momentum suggest a larger move could unfold soon.
Signal of range compression is imminent
$ETH It is trading between $2,050 and $2,350, forming a clear horizontal range. This zone reflects the balance between buyers and sellers. However, repeated rejections around $2,350 confirm sustained supply pressure. At the same time, the lows continue to rise higher, indicating that buyer interest is gradually increasing.
Additionally, the Bollinger Bands have contracted significantly, indicating reduced volatility. This setup is often done before a strong directional move.
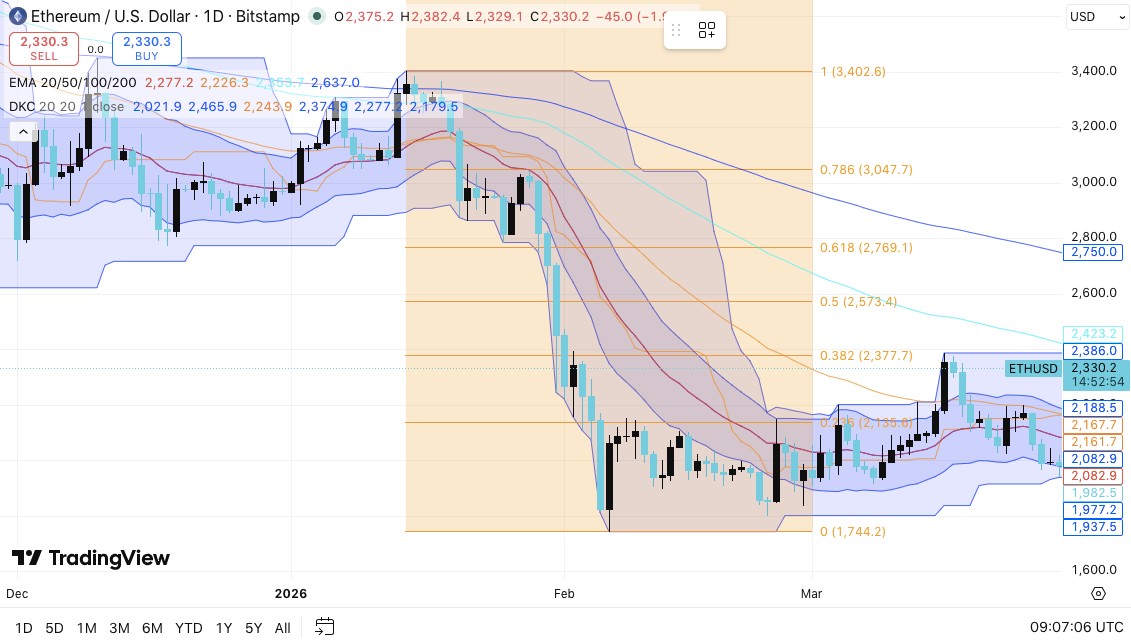
Moreover, the price is still below the 50, 100, and 200 EMAs, reinforcing the bearish bias. Still, the flattening of short-term averages suggests that selling pressure is easing.
Fibonacci levels add further context. $ETH It has struggled below the 0.5 retracement around $2,570, highlighting limited bullish strength. Therefore, the bulls need to regain this level to convincingly change momentum.
Key levels define market direction
Support remains solid between $2,080 and $2,100, and the price has bounced back and forth multiple times. A break below this zone could trigger a move towards $2,000. Furthermore, losing that psychological level could expose the $1,740 swing low.
Related: $XRP Price prediction: Cup and handle scheduled for $1.70 $XRP Strongest ETF week of 2026
Upward resistance lies between $2,330 and $2,380. A confirmed breakout above this range could open the way to $2,570.
Above that, $2,770 and $3,040 emerge as stronger resistance zones. Therefore, the $2,300 to $2,350 area serves as a key axis for the next trend.
Derivatives and flows reflect prudent positioning
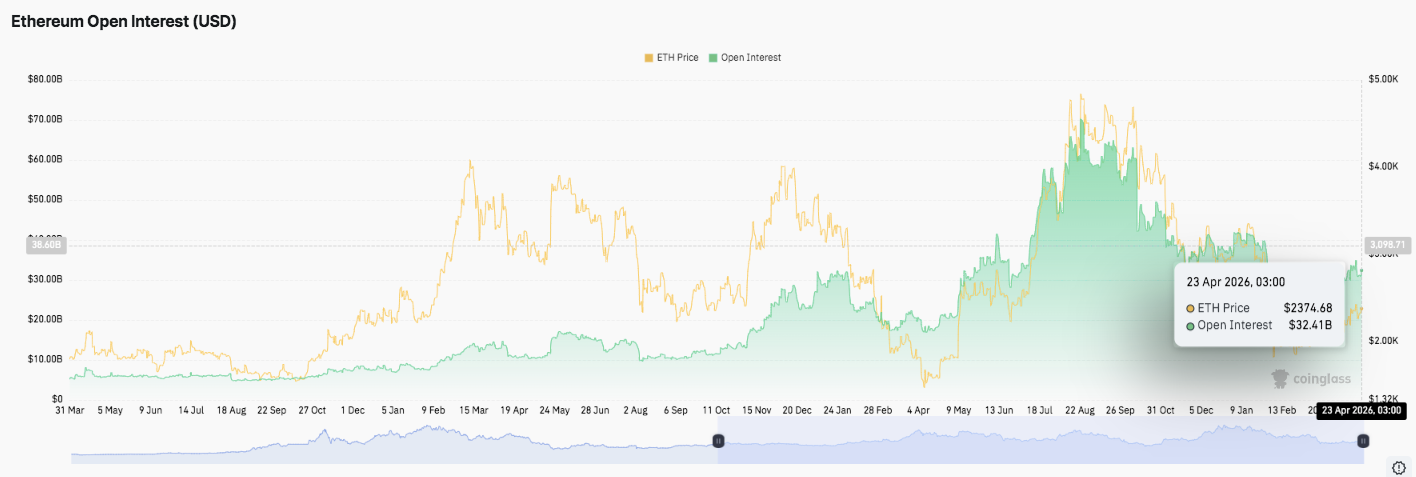
Ethereum’s open interest has shown a steady upward trend despite periodic declines. This pattern indicates growing participation in derivatives markets. Importantly, the recent stabilization suggests that traders are maintaining exposure rather than exiting positions.
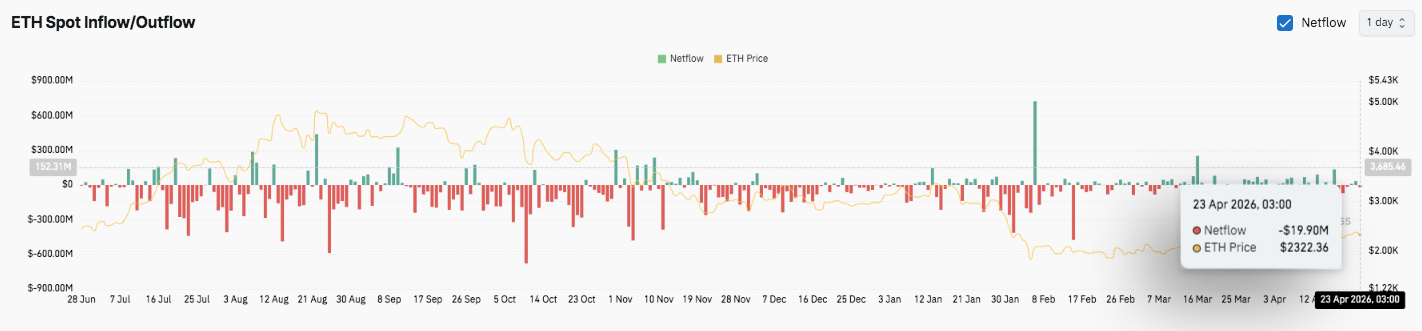
Spot flow, on the other hand, reveals a more reactive environment. Capital moves in and out based on price movements, not long-term certainty. Early accumulation was replaced by runoff during the decline phase. However, intermittent spikes in inflows likely indicate opportunistic purchases from major corporations.
Ethereum technical outlook ($ETH) price
Ethereum maintains a well-defined technical structure as it trades through an extended period of consolidation following the collapse of the initial bear market. Heading into the next big movement window, the key levels are well established and will continue to guide market action.
Top level: $2,330, $2,380, and $2,570 serve as immediate resistance hurdles. A clean breakout of this cluster could extend the momentum to $2,770 and $3,040, where stronger Fibonacci resistance lines coincide with the previous structural rejection zone.
Related: Spark Price Prediction: SPK soars 78% as post-breakout price hits $0.070
Lower price level: $2,080 acts as the first major support, followed by $2,000 as an important psychological and structural foundation. A more detailed breakdown would reveal $1,970 and potentially the last major capitulation low at $1,740.
Upper limit of resistance: The $2,570 level (0.5 Fibonacci retracement) remains a key threshold for a meaningful bullish reversal. Additionally, a cluster of 50-200 EMAs above current price continues to act as a dynamic resistance level, reinforcing the broader bearish-to-neutral bias.
Looking at the technical picture, we see that Ethereum is compressed within a wide range of $2,050 to $2,350. As a result, volatility is decreasing and prices are hoisting towards an expansionary phase. This setup often precedes a sharp directional move once liquidity is established on either side of the range.
Will Ethereum go up or down?
Ethereum’s near-term direction will depend on whether buyers can hold onto the $2,080-$2,100 support zone long enough to challenge the $2,350 resistance ceiling. Continued buying pressure above this range would indicate accumulation and pave the way for $2,570 and $2,770.
Moreover, a confirmed breakout above $2,350 with strong volume could decisively shift momentum in the bulls’ favor. This will also improve the alignment of the EMA and strengthen the medium-term structure.
However, if it fails to sustain $2,080, its current fundamentals will weaken. As a result, Ethereum could retest $2,000 and fall towards $1,740 if selling pressure accelerates.
For now, Ethereum remains in a significant consolidation zone. Additionally, reduced volatility and mixed flow behavior suggest an impending expansion phase. The direction of the next breakout will depend on confidence, changes in liquidity, and whether resistance or support gives way first.
Related: Cardano Price Prediction: Breakout Test Set at $0.2514 on Fund Cut and Visa Card Launch