


As of April 7, 2026, just after 8 a.m. ET, Bitcoin was hovering just above the $68,000 zone with mixed signals on the hourly, four-hourly, and daily charts.
Important points:
- As of April 7, 2026, Bitcoin was trading above about $68,000 and below the $70,000 resistance level.
- The chart shows 12 bearish signals between the moving averages, reinforcing the weak trend momentum.
- Bitcoin continues to range between $65,000 and $72,000. Breaking above $70,000 remains the key to the next move.
Bitcoin chart outlook
Bitcoin’s price movement reflects a firm consolidation in the market, with market data showing it at $68,348.38, with Bitstamp showing about the same value. The intraday range between $68,157 and $70,242 indicates a lack of directional confidence, but the $70,000 level still acts as a stubborn ceiling. Price remains compressed between well-defined support around $69,500 and resistance just above $70,000, a setup that tends to frustrate breakout traders and reward patience instead.
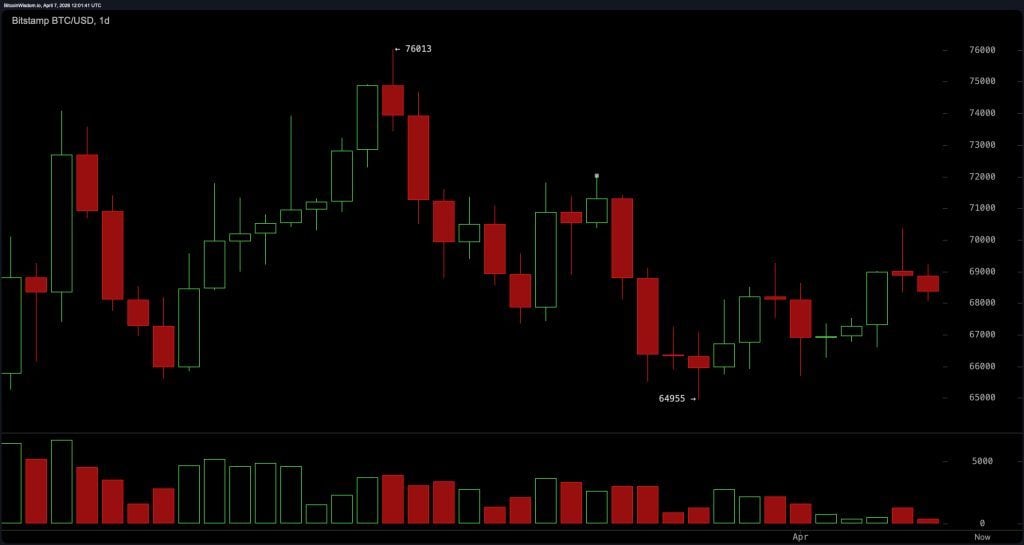
On the daily chart, Bitcoin continues to swirl within a wide range of $65,000 to $72,000 following a rebound from the mid-$70,000 region. Prices have stabilized around the mid-range of $68,500 to $69,500, with buyers holding the edge but failing to generate sustained upward momentum. This reflects a neutral structure rather than a confirmed trend reversal, with neither side showing an advantage. In other words, the market is holding its breath but is not promising what will happen next.
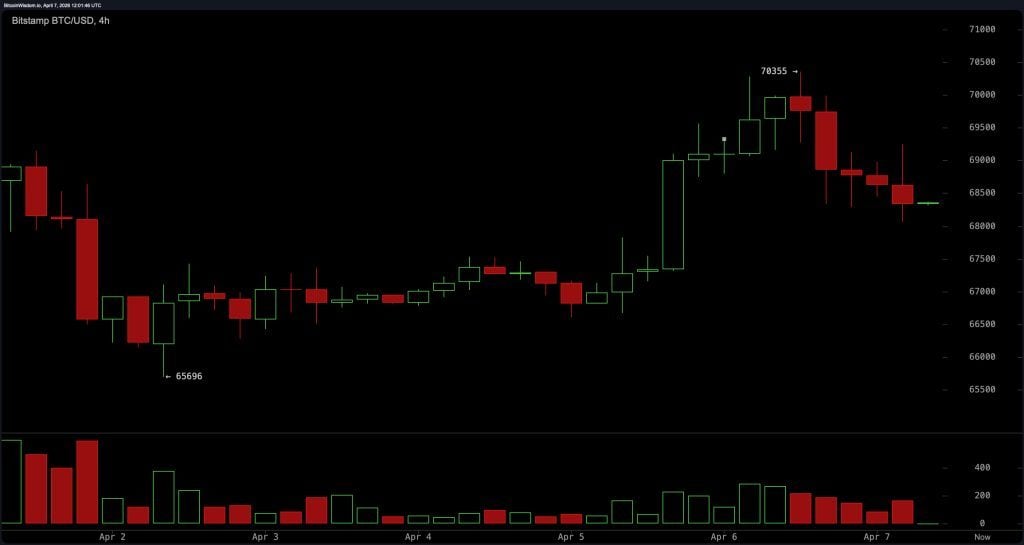
If we zoom in on the 4-hour chart, the tone shifts slightly bearish. The recent push to $70,300 was decisively rejected, followed by a series of high declines and mild selling pressure. Currently, the $69,800-$70,500 zone is acting as short-term resistance, with support located between $67,000 and $68,000. The failure of this breakout attempt suggests that bullish momentum is not only weakening, but is being actively suppressed, reinforcing the idea that any attempt to move higher requires stronger volume confirmation to gain traction.
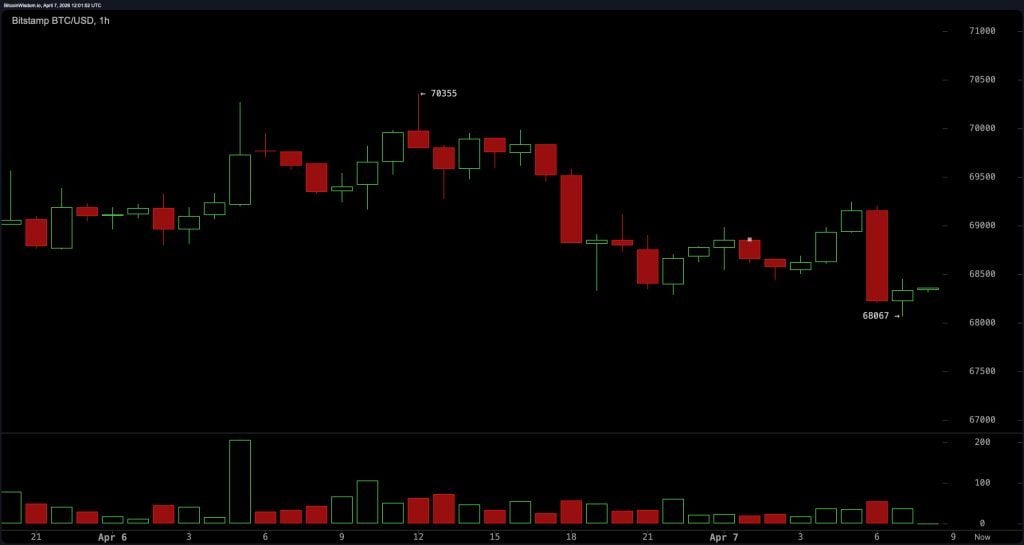
The hourly chart makes the story clearer, with near-term indecision tipping the scales bearishly. A core of rejection near $70,300 triggered a sharp decline towards $68,000, after which price entered a narrow sideways band between $68,000 and $69,000. This extremely heavy environment reflects a lack of follow-through on both sides, with traders reacting to levels rather than initiating trends. The short-term structure remains fragile until the price confidently regains the $69,500-$70,000 zone.
Indicator data further supports the market’s hesitation. The Relative Strength Index (RSI) is hovering at 49, while the Stochastics, Commodity Channel Index (CCI), and Average Directionality Index (ADX) are all recording neutral values, reinforcing the overall lack of momentum.
The Awesome Oscillator remains negative at -1,424 and Momentum indicates a bearish signal at 2,035, while the Moving Average Convergence Divergence (MACD) level indicates a modest bullish signal at -510. It’s a lot of different situations and it’s not just a kind frame that a trader has on their wall.
Moving averages paint a more definitively bearish picture. The Exponential Moving Average (EMA) (10) of $68,116 and the Simple Moving Average (SMA) (10) of $67,634 provide short-term support signals, but the higher time frame averages are almost all negatively tilted.
The EMA (20) of $68,435 and SMA (20) of $68,385 both indicate weakness, but longer-term levels such as the EMA (50) of $70,307 and the SMA (100) of $76,242 are still well above the price. The broader trend picture still reflects significant overhead pressure, with the EMA (200) at $83,949 and SMA (200) at $88,898.
Bullish verdict:
Bitcoin regains $70,000 with volume, turning resistance into support and paving the way for $71,000-$72,000 as momentum indicators stabilize and short-term structure moves from range-bound to expansion.
Bear verdict:
Bitcoin fails to hold the $69,500 support, confirming high declines across the 1-hour and 4-hour charts, with downside targets extending to $67,500, $66,000, and potentially $65,000 as the moving averages continue to weigh on price.