


Ethereum is trading below nearby resistance as analysts focus on key support zones that will determine whether the market stabilizes or extends the correction.
Ethereum ($ETH) is trading around $2,063, down 2.99% over the past day as selling pressure weighs on the market. On the intraday chart, we see that the price briefly rose to around $2,160 early in the session before losing momentum and sending the asset into a downtrend. After the initial decline, Ethereum continues to hover within a descending channel between approximately $2,060 and $2,120, suggesting that the market is stabilizing after the sharp decline.
Performance data across multiple time frames reflects broader weakness in Ethereum’s recent trend. The asset is down 3.05% in the past 24 hours and 7.43% in the past 30 days, while long-term indicators are pointing to a deeper correction, including a decline of 31.81% in 90 days.
Despite recent losses, Ethereum It remains up 1.76% over the past week. Traders are now watching to see if the market can regain momentum or if it continues to consolidate around current levels.
Ethereum price prediction
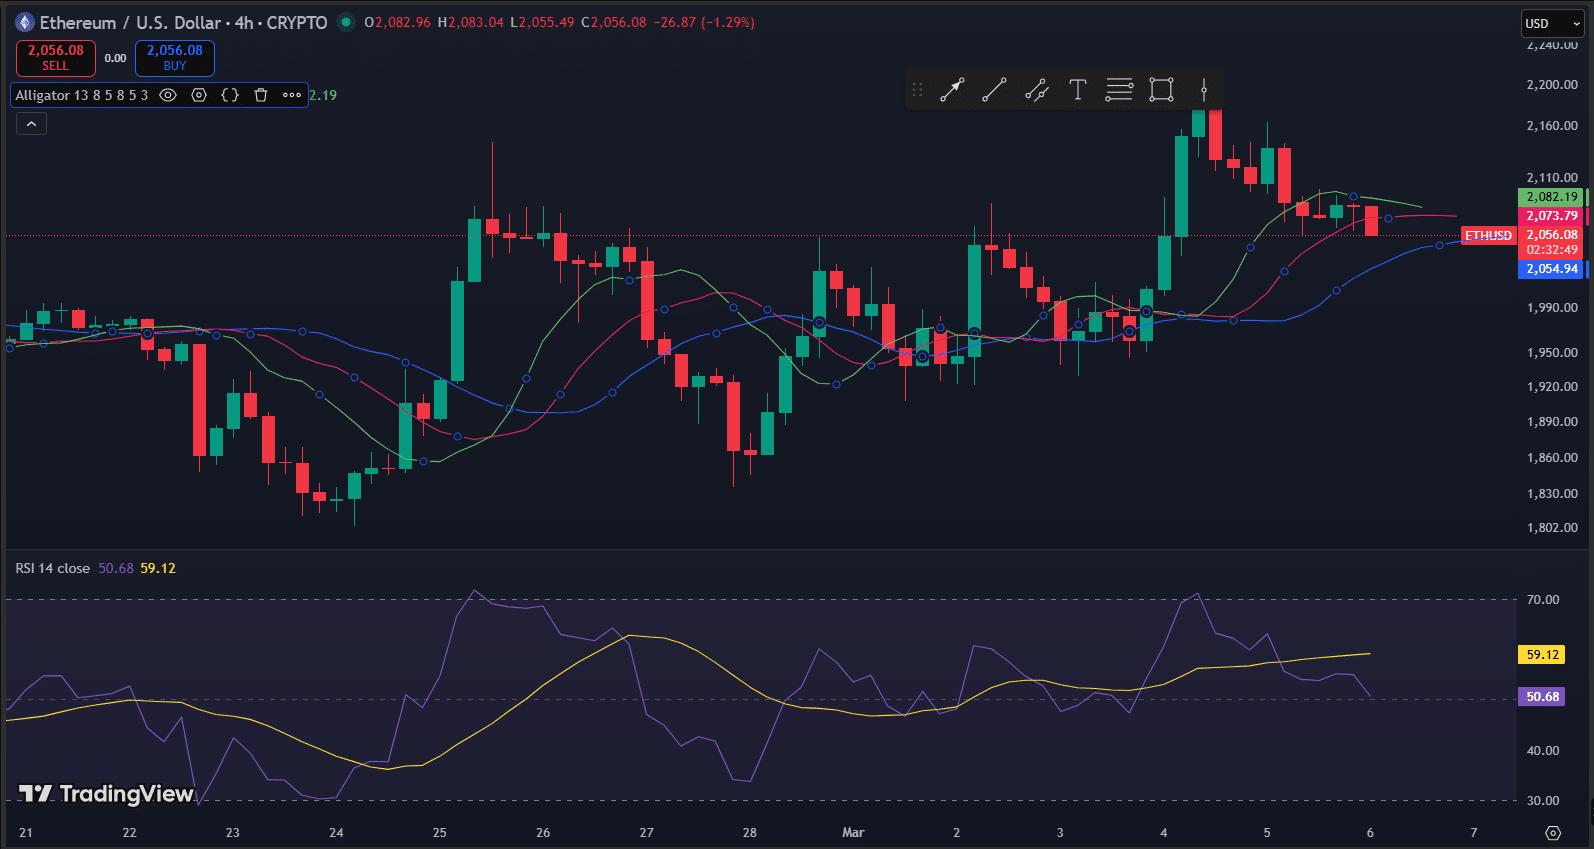
On TradingView’s 4-hour chart, Ethereum is showing signs of slowing momentum after a recent uptrend towards the $2,200 area. $ETH‘s price is hovering just below the index line for the Williams Alligator, which has lips near $2,082, teeth near $2,073, and jaws near $2,055.
Ethereum 4H price analysis
The concentration of these lines suggests that the market is moving into a consolidation phase after an initial rally. The $2,050 (joe) area serves as a short-term support zone as the price moves around the indicator structure, while the $2,070 to $2,085 range forms immediate resistance.
Meanwhile, the relative strength index remains at a level just above 50, indicating that neither buyers nor sellers have strong control and the market momentum is balanced. Earlier on the chart, the RSI briefly approached the 70 region, reflecting the previous build-up of bullish pressure before losing momentum.
Currently, the indicator is stable near the midpoint, suggesting that the market is resetting after the rally. If the RSI starts to rise again and the price breaks above the clustered Alligator line, Ethereum could attempt further gains towards the $2,100 to $2,150 resistance area. Failure to recover these levels could result in a short-term sideways decline in asset trading.
commentator’s statement
Meanwhile, Ethereum is currently testing the important 50% Fibonacci retracement level near $2,010, which one analyst believes is a key support cluster for the ongoing correction structure.
According to For crypto analyst More Crypto Online, the market has yet to see a clear local bottom as the price continues to oscillate between the 38.2% retracement near $2,054 and the 50% level near $2,010.
This area forms a technical support band with deeper downside protection emerging around the 61.8% retracement at approximately $1,967.
$ETH price prediction
On the upside, Ethereum faces several resistance barriers that could determine whether the market returns to an uptrend. Initial resistance lies near the 23.6% retracement level near $2,109, followed by the previous swing high zone near $2,180 to $2,213, which is consistent with the broader correction wave structure highlighted on the chart. A sustained move above these levels could pave the way for higher targets near $2,325 and $2,397.