


Solana prices remained under pressure this week, continuing a downward trend since peaking at $252 last September.
summary
- Solana prices continued their strong downward trend this week.
- Key network metrics such as active addresses and transactions continued to spike.
- Its ETF inflows continue to increase and outpace Ethereum.
Solana ($SOL) token has fallen for eight consecutive weeks and is currently hovering near its lowest level since January 2024. It has fallen more than 73% from its peak level in January last year.
The ongoing Solana price collapse continued even as the network’s growth gained momentum and outperformed Ethereum (ETH) on key metrics.
For example, the Spot Solana ETF added more than $61 million in inflows this month, according to data compiled by SoSoValue. It has added assets for the past five consecutive months, with cumulative inflows exceeding $932 million. These funds currently manage more than $795 million in assets.
Meanwhile, the Ethereum ETF shed more than $326 million in assets in February. Over the past four months, it has shed more than $2 billion, bringing cumulative net asset inflows to more than $11.6 billion.
You may also like: Inside Vitalik Buterin’s plan to make Ethereum quantum-resistant
Solana also far outperforms Ethereum in other areas. For example, Solana processed over 2.6 billion transactions in the past 30 days, while Ethereum processed 66.7 million transactions, according to data compiled by Nansen.
Similarly, Solana earned over $25 million in fees, while Ethereum earned $18 million in the same period. These fees have made the company the second most profitable chain in the crypto industry after Justin Sun’s Tron.
Meanwhile, the number of active addresses on Ethereum decreased by 5.3% over the past 30 days, while the number of active addresses on Solana increased by 30% to over 114 million.
Solana Price Prediction: Technical Analysis
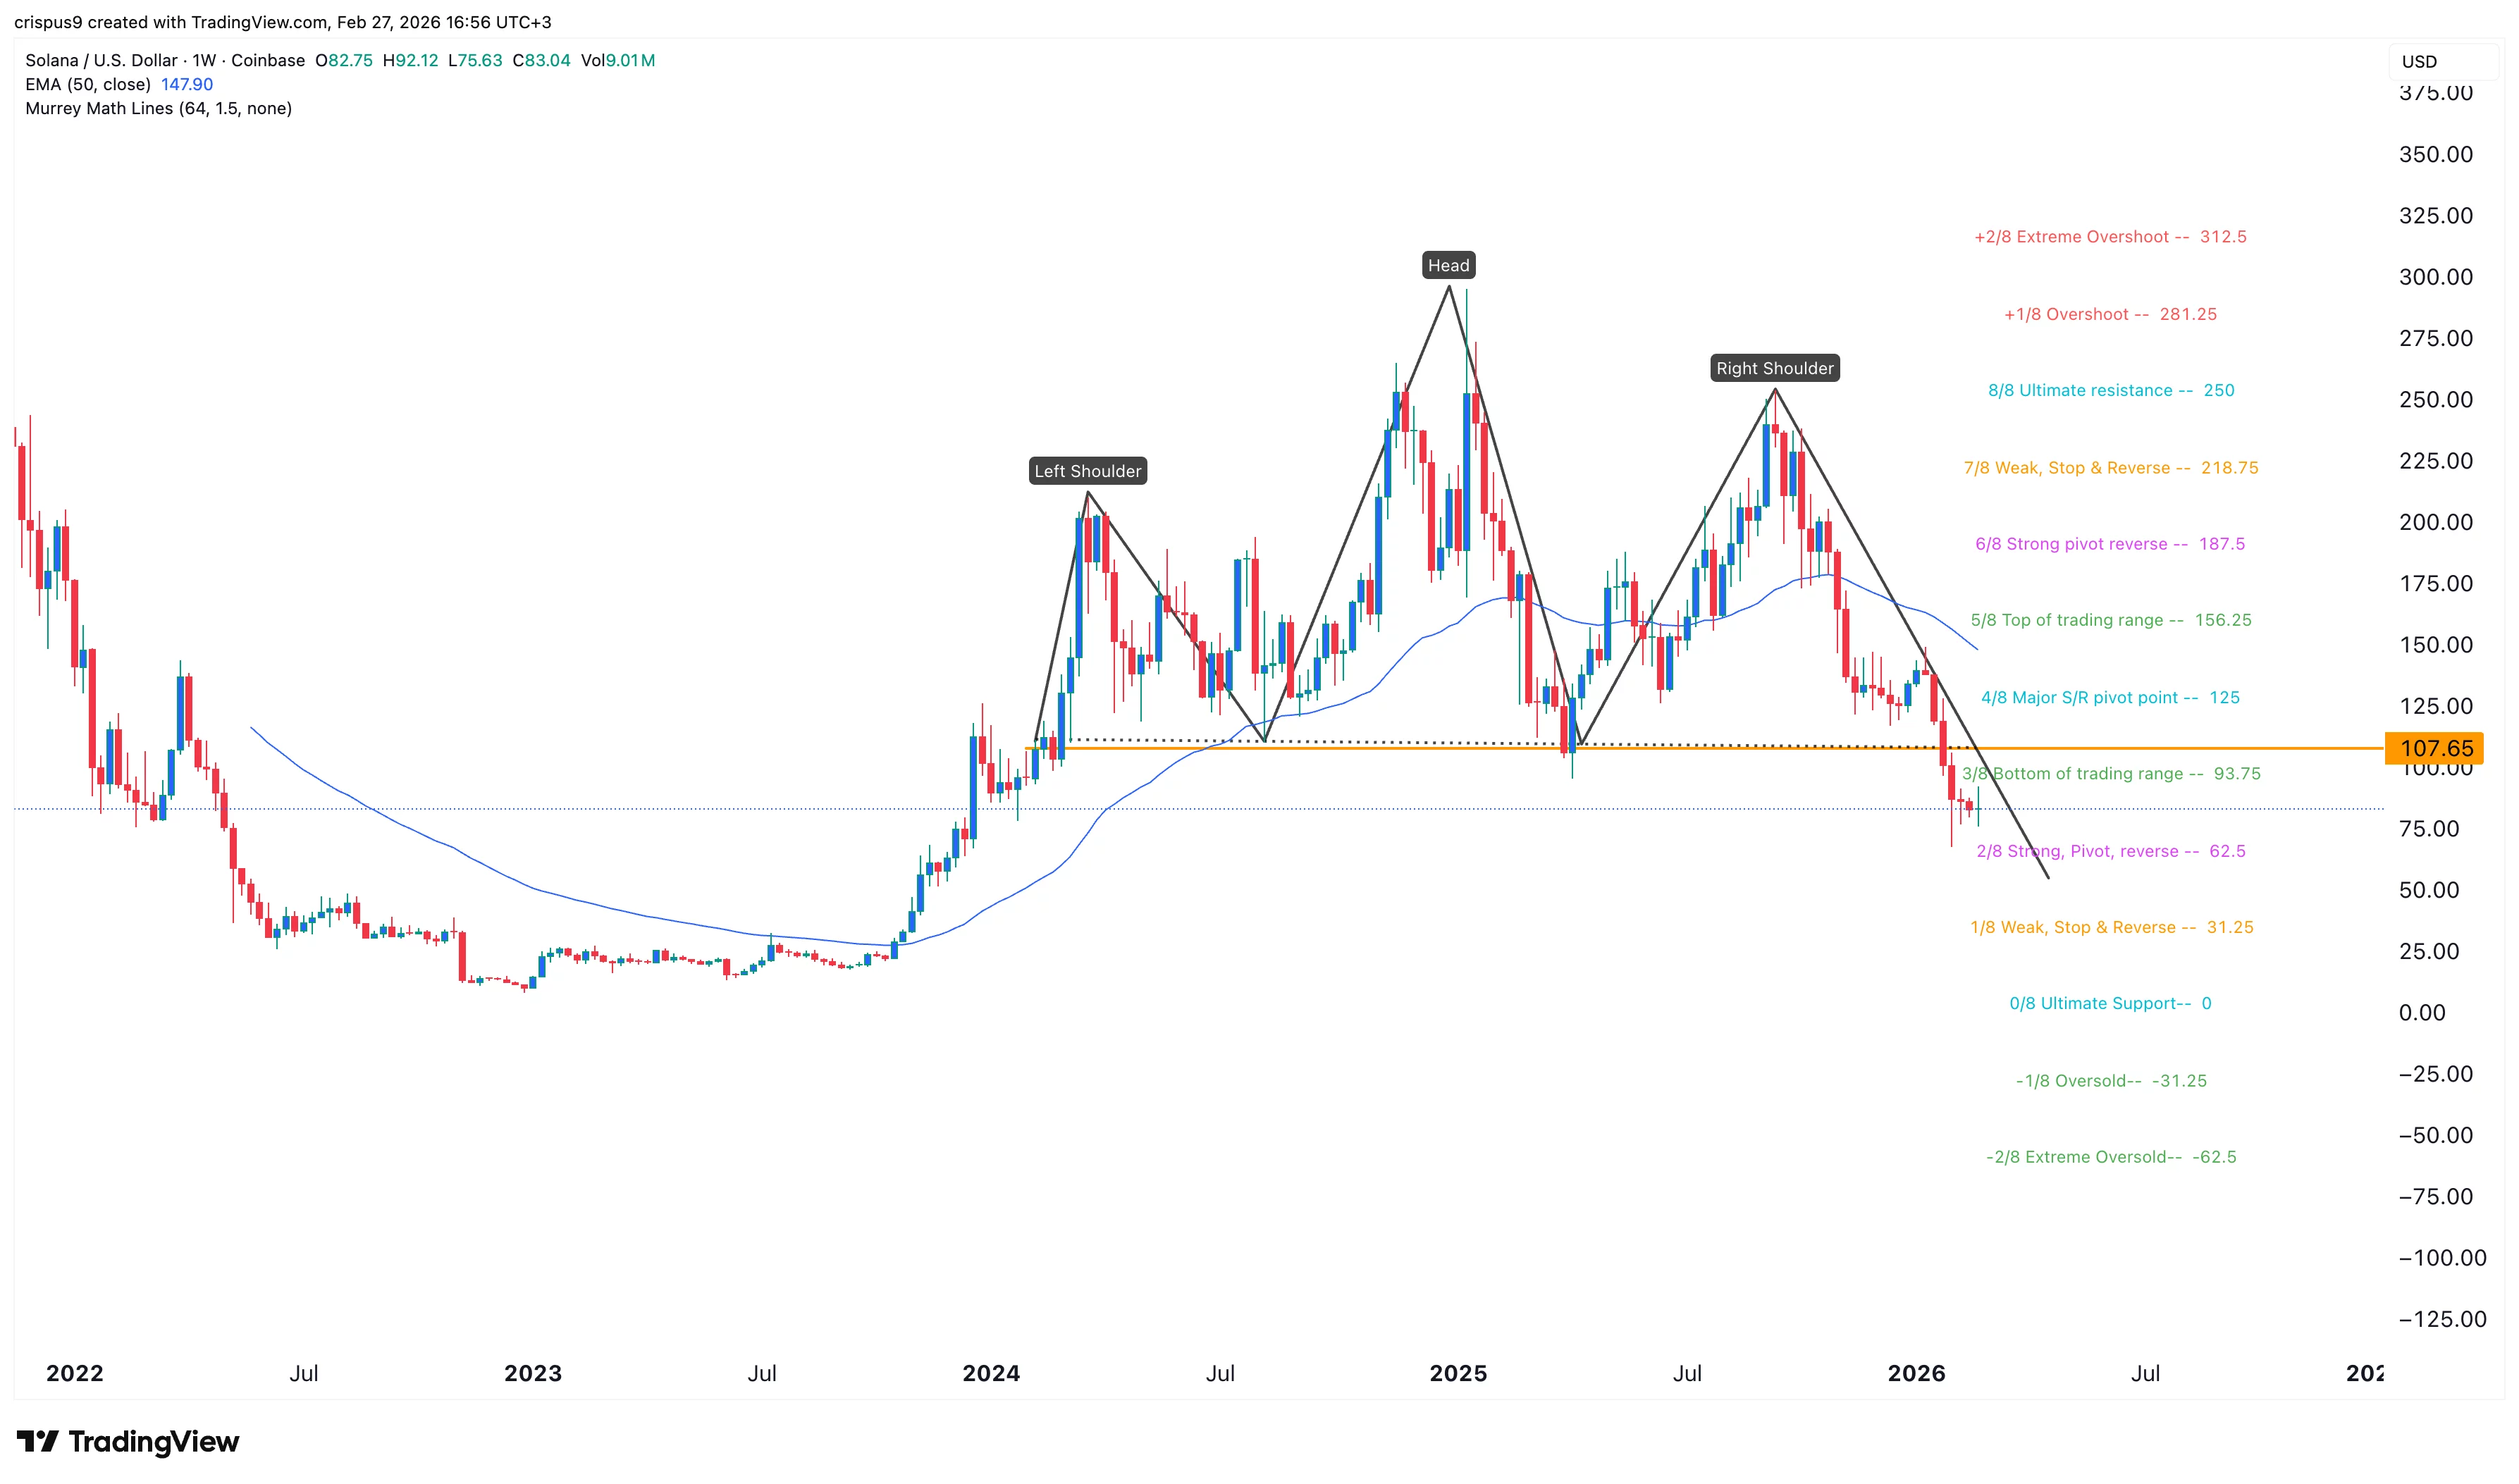
$SOL Price list |Source: crypto.news
Weekly timeframe chart shows: $SOL Prices have remained in a bear market for the past few months. The price fell below the major support level at $107, which is the neckline of the head-and-shoulders chart pattern.
The token fell below the key support level at $93.75, the bottom of the Murray Math Line Tool trading range. It also remains below the 50-week and 100-week exponential moving averages.
Solana also remains below the supertrend indicator. Therefore, the token will continue to fall, potentially dropping to $62.5 on the Murray Math Line Tools Strong, Pivot, and Reverse.
The coin will then rebound if the ongoing crypto market crash occurs, which could happen in the coming weeks or months.
You may also like: Solana Price Prediction: Chart maintains mid-$80s range, but weekly chart shows $50 downside.