


Ethereum is weathering a period of increased volatility and uncertainty, hovering around an important benchmark of $2,000. Recent price movements suggest a temporary stabilization after weeks of selling pressure, but confidence remains limited. Rather than firm support, the $2,000 level is acting as a psychological battleground where short-term positioning, liquidity conditions, and sentiment collide.
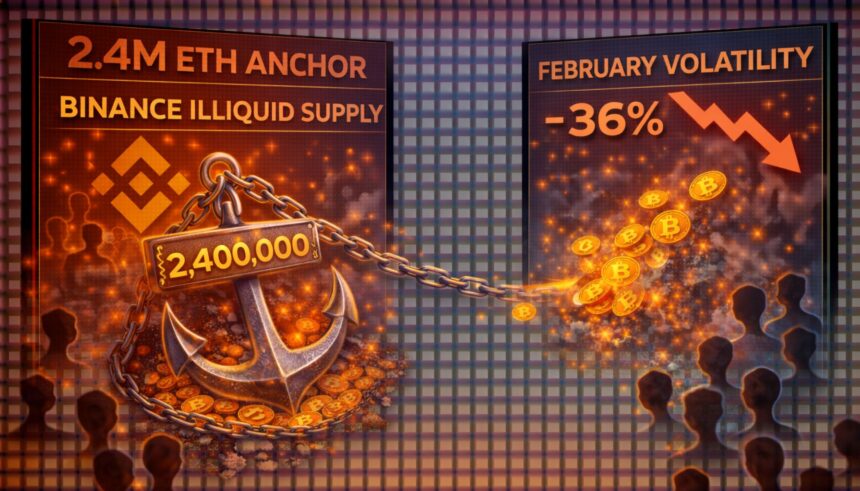
Recent analysis by Arab Chain provides additional structural insights through ETH Binance’s liquid and non-liquid supply models. This framework separates the Ethereum held on Binance into liquid supply (coins that are immediately available for trading) and illiquid supply (relatively less likely to fluctuate in the short term). As of February, Binance’s total ETH reserves are approximately 3.57 million ETH. Of this amount, approximately 1.16 million ETH is classified as liquid supply and 2.4 million ETH is classified as non-liquid.
This distribution is important. A relatively small number of highly liquid components may reduce immediate pressure on sellers, but it does not eliminate risk if market conditions deteriorate. Conversely, a larger illiquidity base may reflect longer-term holding behavior or strategic positioning rather than imminent distributions.
At a moment when the price is hovering around an important technical pivot, the composition of foreign exchange reserves becomes a key variable in assessing Ethereum’s next structural move.
Liquid and non-liquid supplies exhibit unstable equilibrium
Binance’s current reserve structure suggests that Ethereum is operating within a structurally balanced environment rather than an immediate distribution stage. A significant portion of the coin appears to be relatively dormant, as the majority of the 3.57 million ETH held on the platform is occupied by illiquid supply. Illiquid balances typically have longer holding periods or trade less frequently, which tends to reduce immediate pressure on sellers.

This is important as ETH is currently hovering around $2,000. The predominance of illiquid shares means that most holders are not willing to take a quick exit. In previous cycles, spikes in volatility were often preceded by sharp increases in liquid supply as coins became more readily available for market execution. The dynamics are not yet clear on a large scale.
In contrast, liquid supply has historically expanded during the speculative phase, when traders actively rotate capital or prepare for directional exposure. The lack of significant expansion suggests that speculative intensity remains subdued for now.
A relatively stable gap between liquidity and illiquidity supply indicates an equilibrium between holding behavior and active trading. However, there are conditions to this balance. A meaningful shift towards increased liquid supply would increase the likelihood of new volatility. On the other hand, if the illiquidity advantage persists, it may be possible to absorb price shocks and slow down the acceleration of the decline.
Ethereum tests long-term support as downtrend accelerates
Ethereum is still under structural pressure as its price is hovering around $2,000 after a sharp decline from the $3,200-$3,400 zone. The weekly chart has formed lower highs since the peak in late 2025, indicating that the momentum has decisively shifted to the downside and the bullish structure has clearly been lost.

The price is currently trading below the 50-week moving average and the 100-week moving average, both of which are starting to trend sideways or down. This configuration typically indicates a weakening of the intermediate momentum and a transition to a correction phase. Notably, Ethereum briefly tested levels near $1,800 before rebounding, suggesting there is reactive demand in its liquidity pockets. However, the recovery remains limited and has yet to regain key moving averages.
The 200-week moving average at the bottom of the chart remains sloping upwards, indicating that the broader macro trend has not fully reversed. Historically, this level has served as strong structural support during deeper cycle corrections. If downside pressure increases again, this zone could become an important area to monitor.
The recent selloff saw a significant increase in volume, reflecting forced position adjustments rather than gradual allocations. Since then, activity has slowed, indicating a temporary stabilization.
Featured image from ChatGPT, chart from TradingView.com
editing process for is focused on providing thoroughly researched, accurate, and unbiased content. We adhere to strict sourcing standards, and each page is carefully reviewed by our team of top technology experts and experienced editors. This process ensures the integrity, relevance, and value of your content to your readers.