


Bitcoin price is still trading well above the depths of past bear markets, and that distance feels like it’s making the current moment quite confusing. Behind the scenes, a large share of the market is already suffering.
According to on-chain data, approximately 46% of the Bitcoin supply was in losses by early April, meaning that almost half of the coins on the network were last purchased at a price above the current market price.
Markets tend to become emotionally unstable when many people find themselves out of positions, and the gap between what the price chart shows and what the holder base actually feels can be very large.
That’s why the $60,000 range stands out. The numbers themselves are nice, round, and memorable, but their real significance lies in how they influence behavior. A return to that point would pull more of the market underwater, turning a slow decline into a vertical decline and directly testing whether holders continue to wait or eventually start selling.
Those who bought on the rally have long since shifted their focus from the next high to more difficult questions, such as whether they misread the market, whether they should reduce risk, and whether this drawdown needs to continue. This is an area where bottom prices tend to form, and where panic tends to spread once a foothold is found.
the deeper floors are still standing
The market has been hit, and the fundamental levels that defined the washout of the old cycle remain in place.
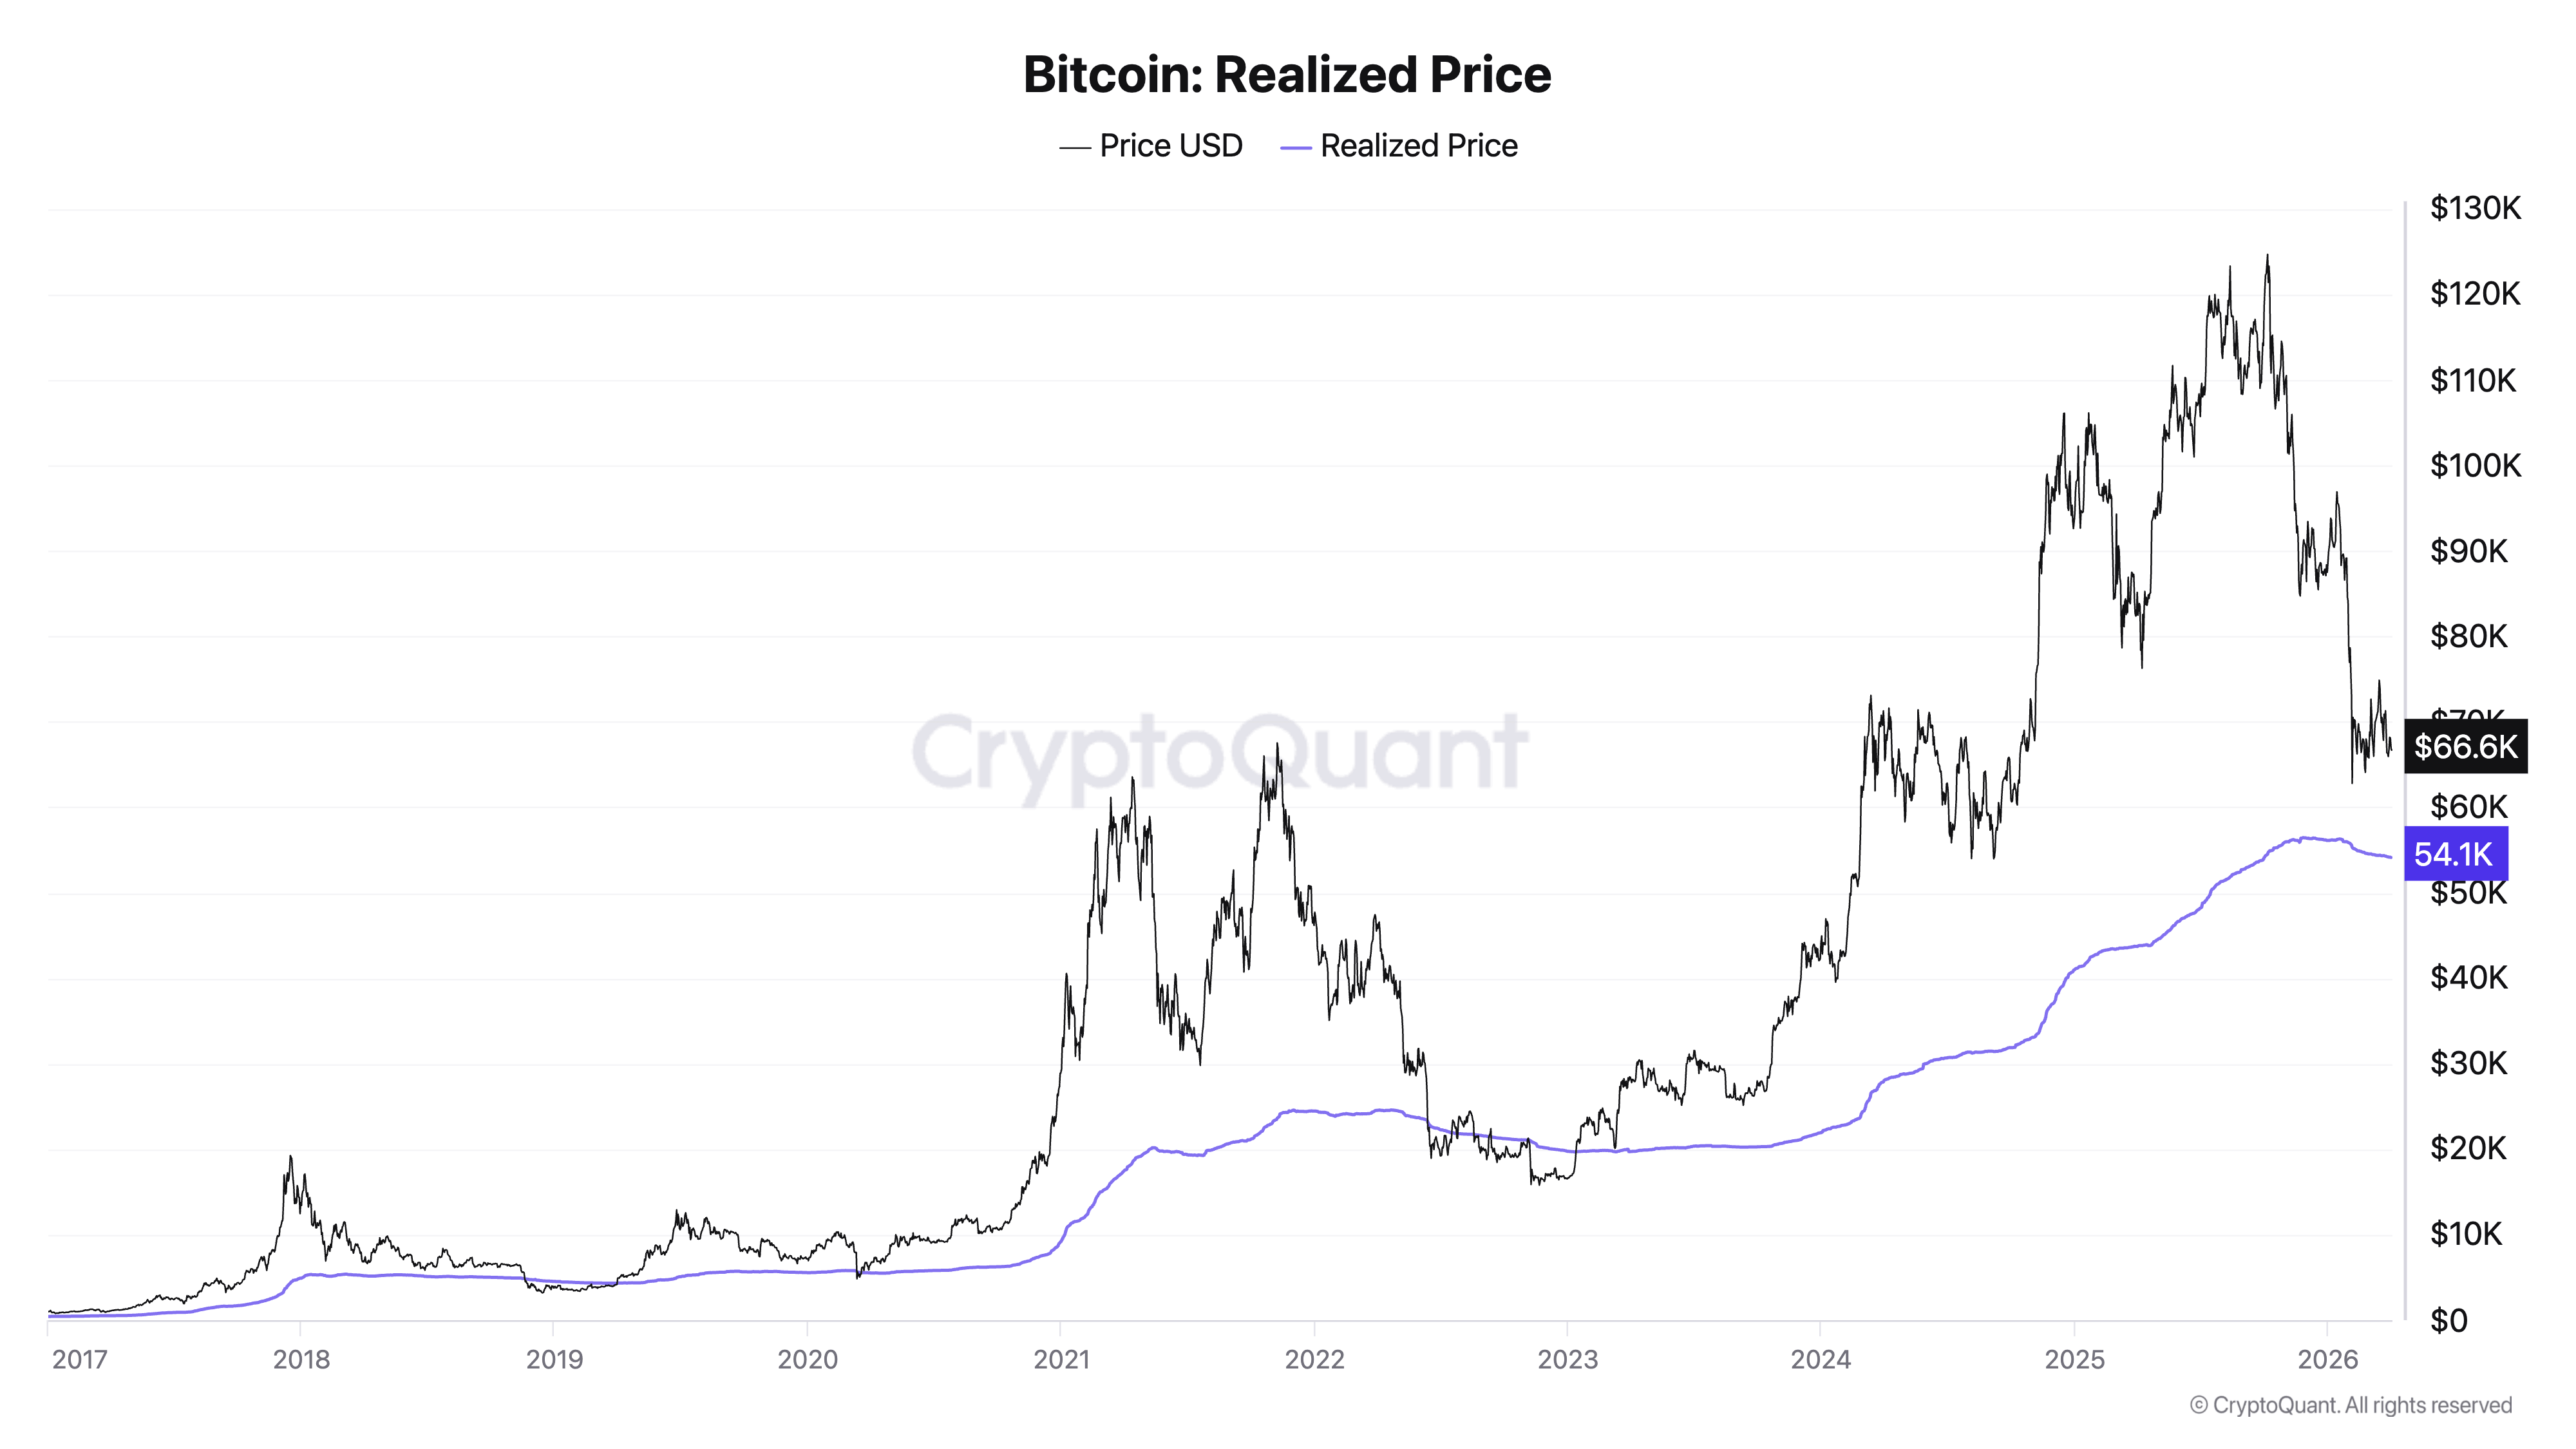
The best example of this is realized price, which is one of the simplest long-term anchors for Bitcoin. This represents the average price of a coin in the network when it was last traded, which is currently around $54,100. Even after this drop, Bitcoin still remains above that level. This means that the average holder of the entire network still has no losses.
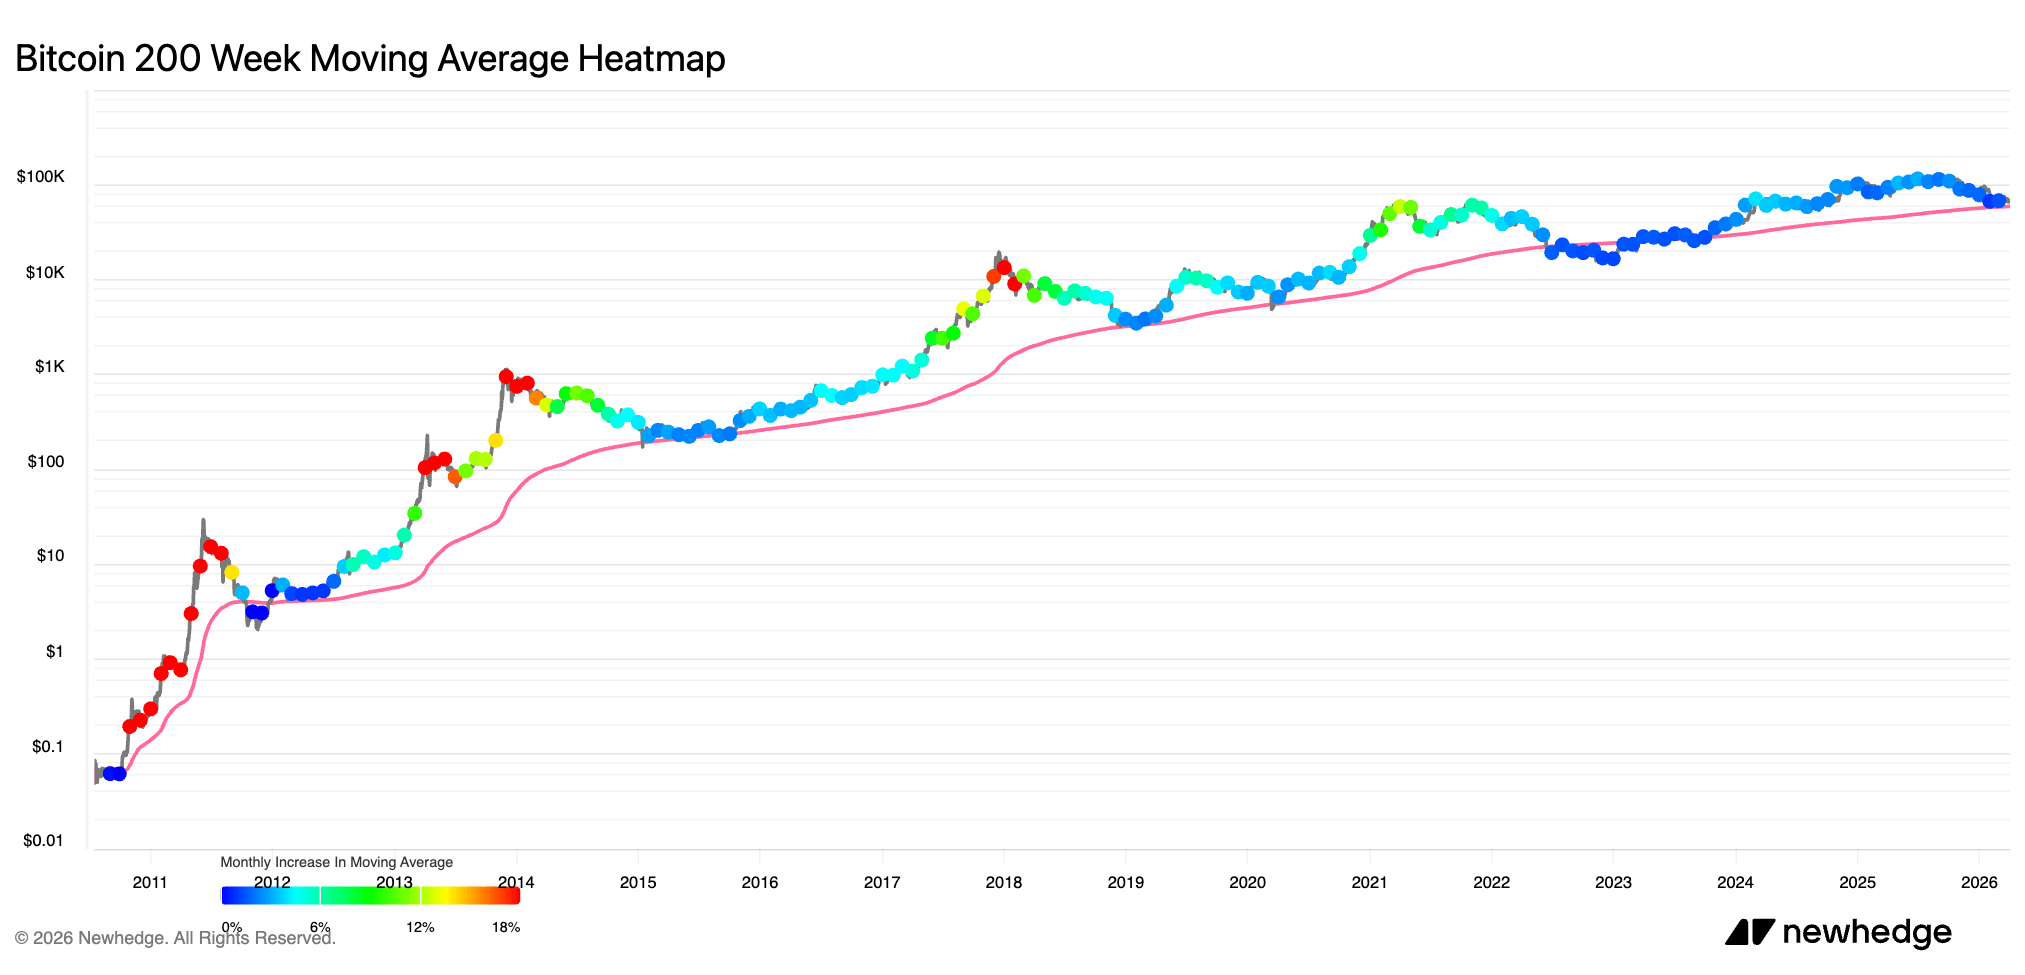
The weekly chart confirms this. Bitcoin is also trading above its 200-week moving average, which is near the low $50,000s, which is a very unusual situation for the market. While the fundamental levels reached by past bear markets remain, they feel weak enough to scare people, sour sentiment, and leave most holders in the red.
This difference may be the most obvious difference between this cycle and previous cycles. Bitcoin still behaves like a volatile asset, and drawdowns still do real damage, but the altitude at which that damage occurs has increased significantly. The pain is occurring higher on the chart than before.
This increase will likely be driven by a broader and stronger ownership base. Bitcoin has attracted more long-term capital and institutional investors over the past few years. This gives the market more structural support than in previous cycles, where fear could drag prices straight through any previous floor with little resistance.
So the real question is whether this market can absorb further discomfort before turning into a forced sell-off.
If Bitcoin falls towards $60,000 and holds there, this cycle will have proven something meaningful. That means nearly half of the market is already underwater, with deeper fundamentals still remaining. If this level breaks and a massive sell-off begins, it won’t be long before we see the familiar bear market sequence play out again.
Visible and structural damage is currently occurring at various levels. While Bitcoin still looks relatively good on the long-term chart, a large portion of its holders are already feeling stressed, and for those looking from outside the asset, that tension is the best way to understand the current moment.
The market is absorbing severe pressure and the question of how long it will take for the fundamentals to change will begin to be answered in the coming weeks.
At the time of press April 3, 2026, 3:27 PM UTCBitcoin ranks first in terms of market capitalization, and the price is above 0.64% Over the past 24 hours. Bitcoin market capitalization is $1.34 trillion The trading volume for 24 hours is 30.11 billion dollars. Learn more about Bitcoin ›
Overview of the virtual currency market
At the time of press April 3, 2026, 3:27 PM UTCthe value of the entire cryptocurrency market is $2.3 trillion in 24 hour volume 74.01 billion dollars. Bitcoin dominance is currently 58.05%. Learn more about the cryptocurrency market ›
(Tag translation) Bitcoin