


Ethereum is closing in on the double-top resistance zone at $2,163 after rejecting the upper bound of the ascending parallel channel for the second time in a row, but a slight bullish MACD crossover on the 4-hour chart raises the question of whether buyers can finally break out or if this pattern will resolve on the downside towards $1,980.
Ethereum (ETH) is trading at $2,051.80 as of April 3, 2026, remaining within an ascending parallel channel that has remained intact since the February lows. Two consecutive rejection candles in the $2,163 to $2,166 zone are clearly marked on both the 4-hour and daily charts, forming a double top structure at the top of the channel. With $6.3 billion of Ethereum options expiring today and CME futures going offline on Good Friday, traders face a weekend of thin liquidity that could amplify directional moves.
On the 4H chart, Ethereum is trading between the downside support of the channel near $2,024 and the upside resistance at $2,163. The 4th hour supertrend at $2,024.73 is still in the green, confirming that the short-term trend has not reversed bearishly. More noteworthy is that the 4H MACD histogram has just entered positive territory at 1.19, with the -3.39 MACD line above the -4.58 signal line. This is a small but technically meaningful bullish crossover and the first since mid-March.
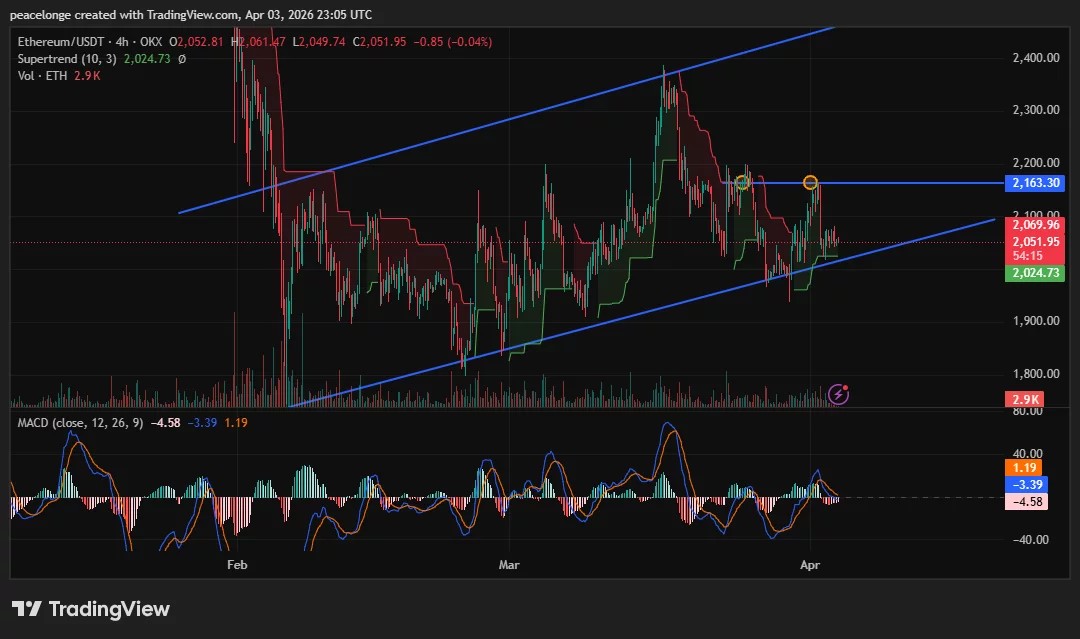
On the daily chart, the situation is more cautious. The MACD histogram is at -7.33 and the MACD line is -11.11, still below the signal at -3.78. The daily supertrend at $1,980.92 remains green, meaning the daily trend has not broken out bearishly. The two orange markers on the chart precisely identify the double top rejection zone from $2,163 to $2,166. A close of the day above $2,166 will invalidate the double top and confirm the upper trendline of the ascending channel as the next target.
Key levels, target prices, and voids
Support is tiered at $2,024 (4-hour supertrend) and $1,980 (daily supertrend). A daily close below $1,980 would bearishly reverse the daily supertrend, breaking the ascending channel structure that has defined the price since February and initiating a move towards $1,900 as the next major floor.
Resistance: The $2,069 area (the upper band of the 4-hour supertrend shown on the chart) acts as a short-term ceiling, followed by the $2,163-$2,166 double-top zone. A clean daily close above $2,166 initially targets $2,250, with a broader bullish case targeting $2,300 to $2,400 if the upper trendline of the channel is targeted.
Bullish channel theory invalidated: 4th hour close below supertrend support at $2,024. The bearish double top theory is invalid: the daily closing price is above $2,200.
Optional expiration and macro context
Approximately $6.3 billion of Ethereum options expire on April 3, with spot prices trading near the maximum pain zone heading into expiration, according to Deribit data. Analysts at AnalyticsInsight noted that this event is “more of a routine settlement than a major turning point,” given that prices are close to maximum pain and the chance of a sharp rally in either direction due to expiration is limited.
As reported by crypto.news, Ethereum fell 3.4% towards the $2,000 support on April 2nd during a broader market decline related to the US and Iran escalation and the $285 million Drift Protocol exploit at Solana. The fact that the 4th hour supertrend held at $2,024 throughout that selling event is a meaningful signal of buyer resilience at that level.
A sustained hold above $2,024 into next week, especially with the fourth-hour MACD histogram remaining positive, would be the first concrete signal that the bulls are regaining near-term control. If $2,024 fails, a double top breakdown and move towards $1,900 would be the main scenarios to watch.