


Bitcoin price falls below $100,000: Opportunity or risk?
$Bitcoin has fallen $100,000 levelTraders are wondering if this is a temporary correction or the beginning of another decline, causing panic across the market.
Historically, all major cycles contained similar moments. That is, a sharp drop that scared investors, followed by a strong run to new highs.
The attached chart shows that Bitcoin is currently located directly in a major multi-month and multi-year support zone. But analysts warn that falling below these levels could open the door to new possibilities. Further decline towards $60,000-$80,000.
So is buying Bitcoin for under $100,000 a wise move, or should investors be cautious?
Let’s break it down.
Short-term chart: BTC sits at key support around $94,000
in 4 hour chartBitcoin is steadily sliding towards a nearby yellow support zone. $94,000-$95,000which is exactly where the price is sitting right now.
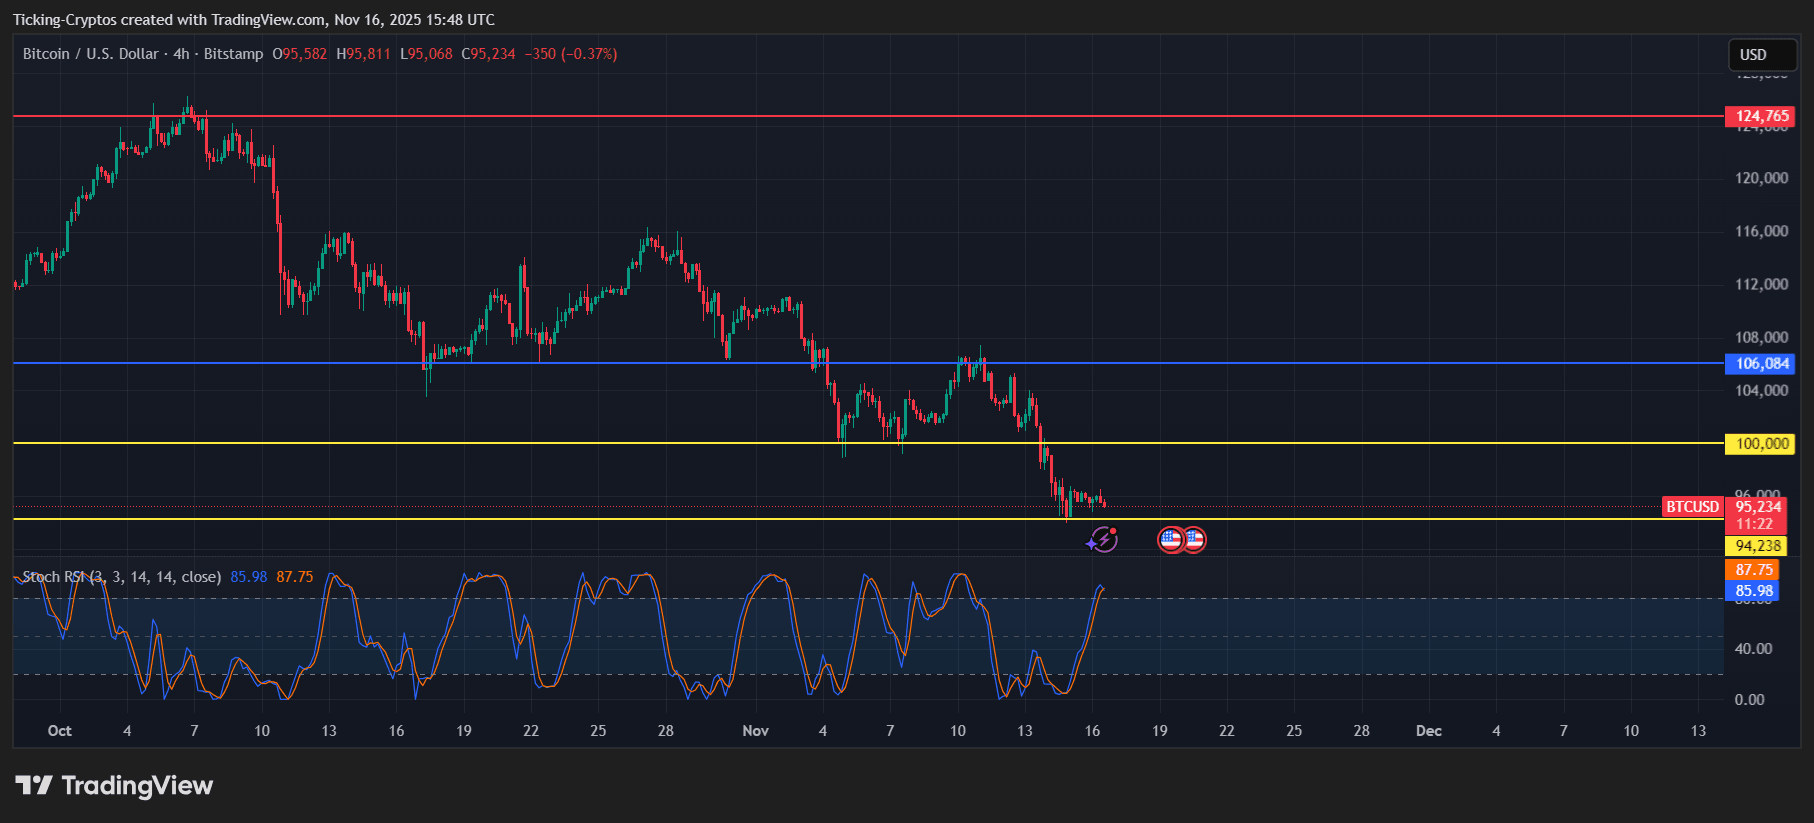
BTC/USD 4 hour chart – TradingView
Key observations from short-term charts:
- $BTC was formed clear downward trend The highs and lows will be lower.
- of $100,000 level failedindicating strong selling pressure.
- momentum indicators such as Stochastic RSI It was already overbought during the rebound, suggesting the market could cool down again.
- The next major support at $94,000 lies far below, meaning a loss of this area could accelerate the sell-off.
This region is the market’s last short-term defense before a larger correction unfolds.
Long term chart: Bitcoin retesting historic breakout zone
of weekly chart You get a clearer long-term picture.
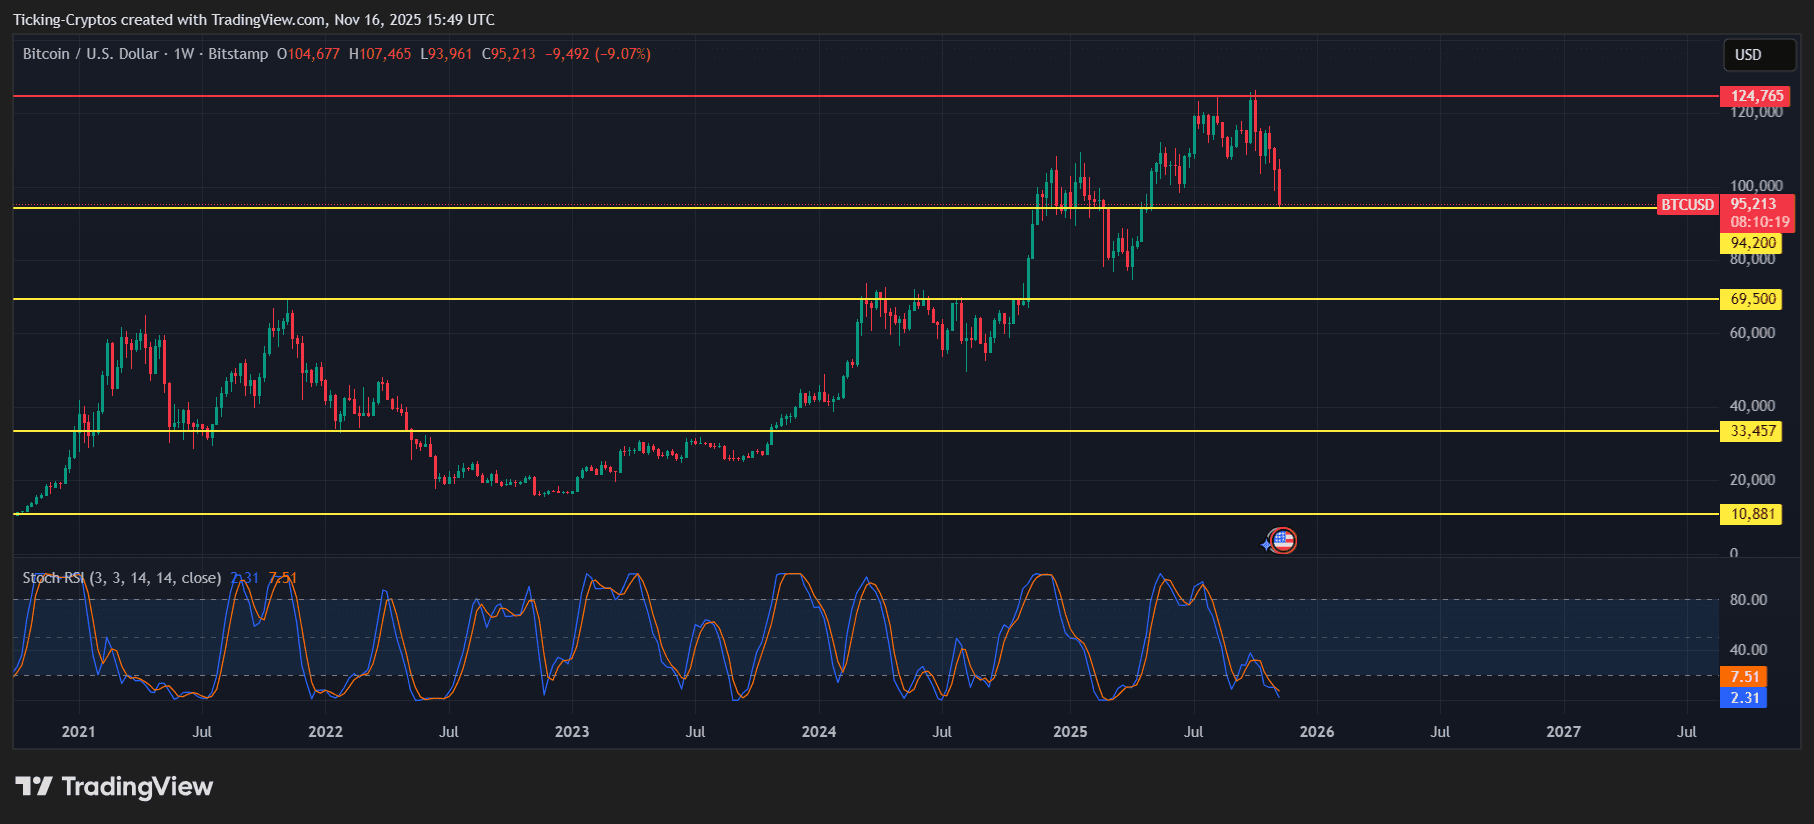
BTC/USD 1 week chart – TradingView
Bitcoin is currently retesting the massive breakout zone that started the rally to $124,000. This area – between $94,000 and $80,000 — acted as follows.
- The big resistance in 2024
- Key breakout areas in 2025
- Historically strong zone Support in a bull market
Even in previous cycles (2013, 2017, 2021), Bitcoin always retested major breakout zones before continuing upward. This structure is still being repeated today.
As long as BTC maintains this multi-year territory, the long-term bullish cycle remains intact.
What happens if Bitcoin falls? Analysts warn of possible $60,000-$80,000 flush
More and more analysts are warning that Bitcoin will lose. $94,000-$95,000the following major liquidity zones are:
These levels match:
- Previous cycle top
- Massive nodes on long-term charts
- Breaker zone for consolidation period 2022-2024
correction of $60,000-$80,000 area Doesn’t break the macro trend – actually matches previous cycles that Bitcoin retraced 35-45% before surging to new highs.
Such declines are painful but historically normal.
Bullish case: Every cycle had a scary correction before a big rally
Despite the concerns, Bitcoin’s long-term structure remains bullish.
In all previous cycles:
- 2013: BTC crashes 75% mid-cycle before hitting new highs
- 2017: BTC fell 40% in three separate sessions before rising 20x
- 2021: BTC fell from $64,000 to $29,000 and then reached $69,000
- 2025: The correction from the current $124,000 to $95,000 is just 23% so far
This is why long-term investors often use these sharp declines as accumulation zones.
Macrocatalysts remain powerful.
- Spot ETFs continue to attract institutional investors
- Global adoption continues to increase
- The supply shock caused by the halving continues.
- Market cycle reaches historic peak 12-18 months after halving — meaning late 2025 to early 2026 is still likely to be the top window
If Bitcoin repeats its past cyclical behavior, purchases under $100,000 could be very long-term.
So, should you buy Bitcoin for under $100,000?
It depends on your timeline.
For long-term investors (6-18 month outlook)
Historically, buying for less than $100,000 has been a winning strategy.
Each cycle rewarded buyers who had accumulated during the severe correction.
In case of short-term intensive type
Please be careful. Losing the $94,000 support could send BTC in the following direction.
Short-term volatility will be high.
If Bitcoin bounces out of this zone
Recovery of the above $106,000 This could confirm a market reversal and trigger a new rally below.
- $115,000
- $124,000 ATH Retest
- Price discovery over $140,000