


In the past hour, the digital leading currency has increased from $89,884 to $90,136 per coin, giving it a market cap of $1.79 trillion. Over the past 24 hours, the company’s trading volume soared to $47.4 billion, fluctuating between an intraday low of $87,315 and a high of $89,963. Despite some loss of momentum, the charts suggest that Bitcoin is in for the long run. Calculating, calm, and a little cautious about his next move.
Bitcoin chart outlook
The daily chart shows that a recovery is underway, but it is not without drama. After peaking at around $97,939, Bitcoin plummeted to $86,000, only to crawl back up with enough confidence to grab attention. A drop in heavy volume indicated a decline, but a flicker of green on light volume suggests an early bullish re-entry.
The support around $86,000 is holding firm, and a tentative bottom appears to be forming. Still, the resistance between $91,000 and $93,000 is where things get dicey, and traders may want to keep an eye on candlestick movement on the one hand and volume divergence around these zones on the other.
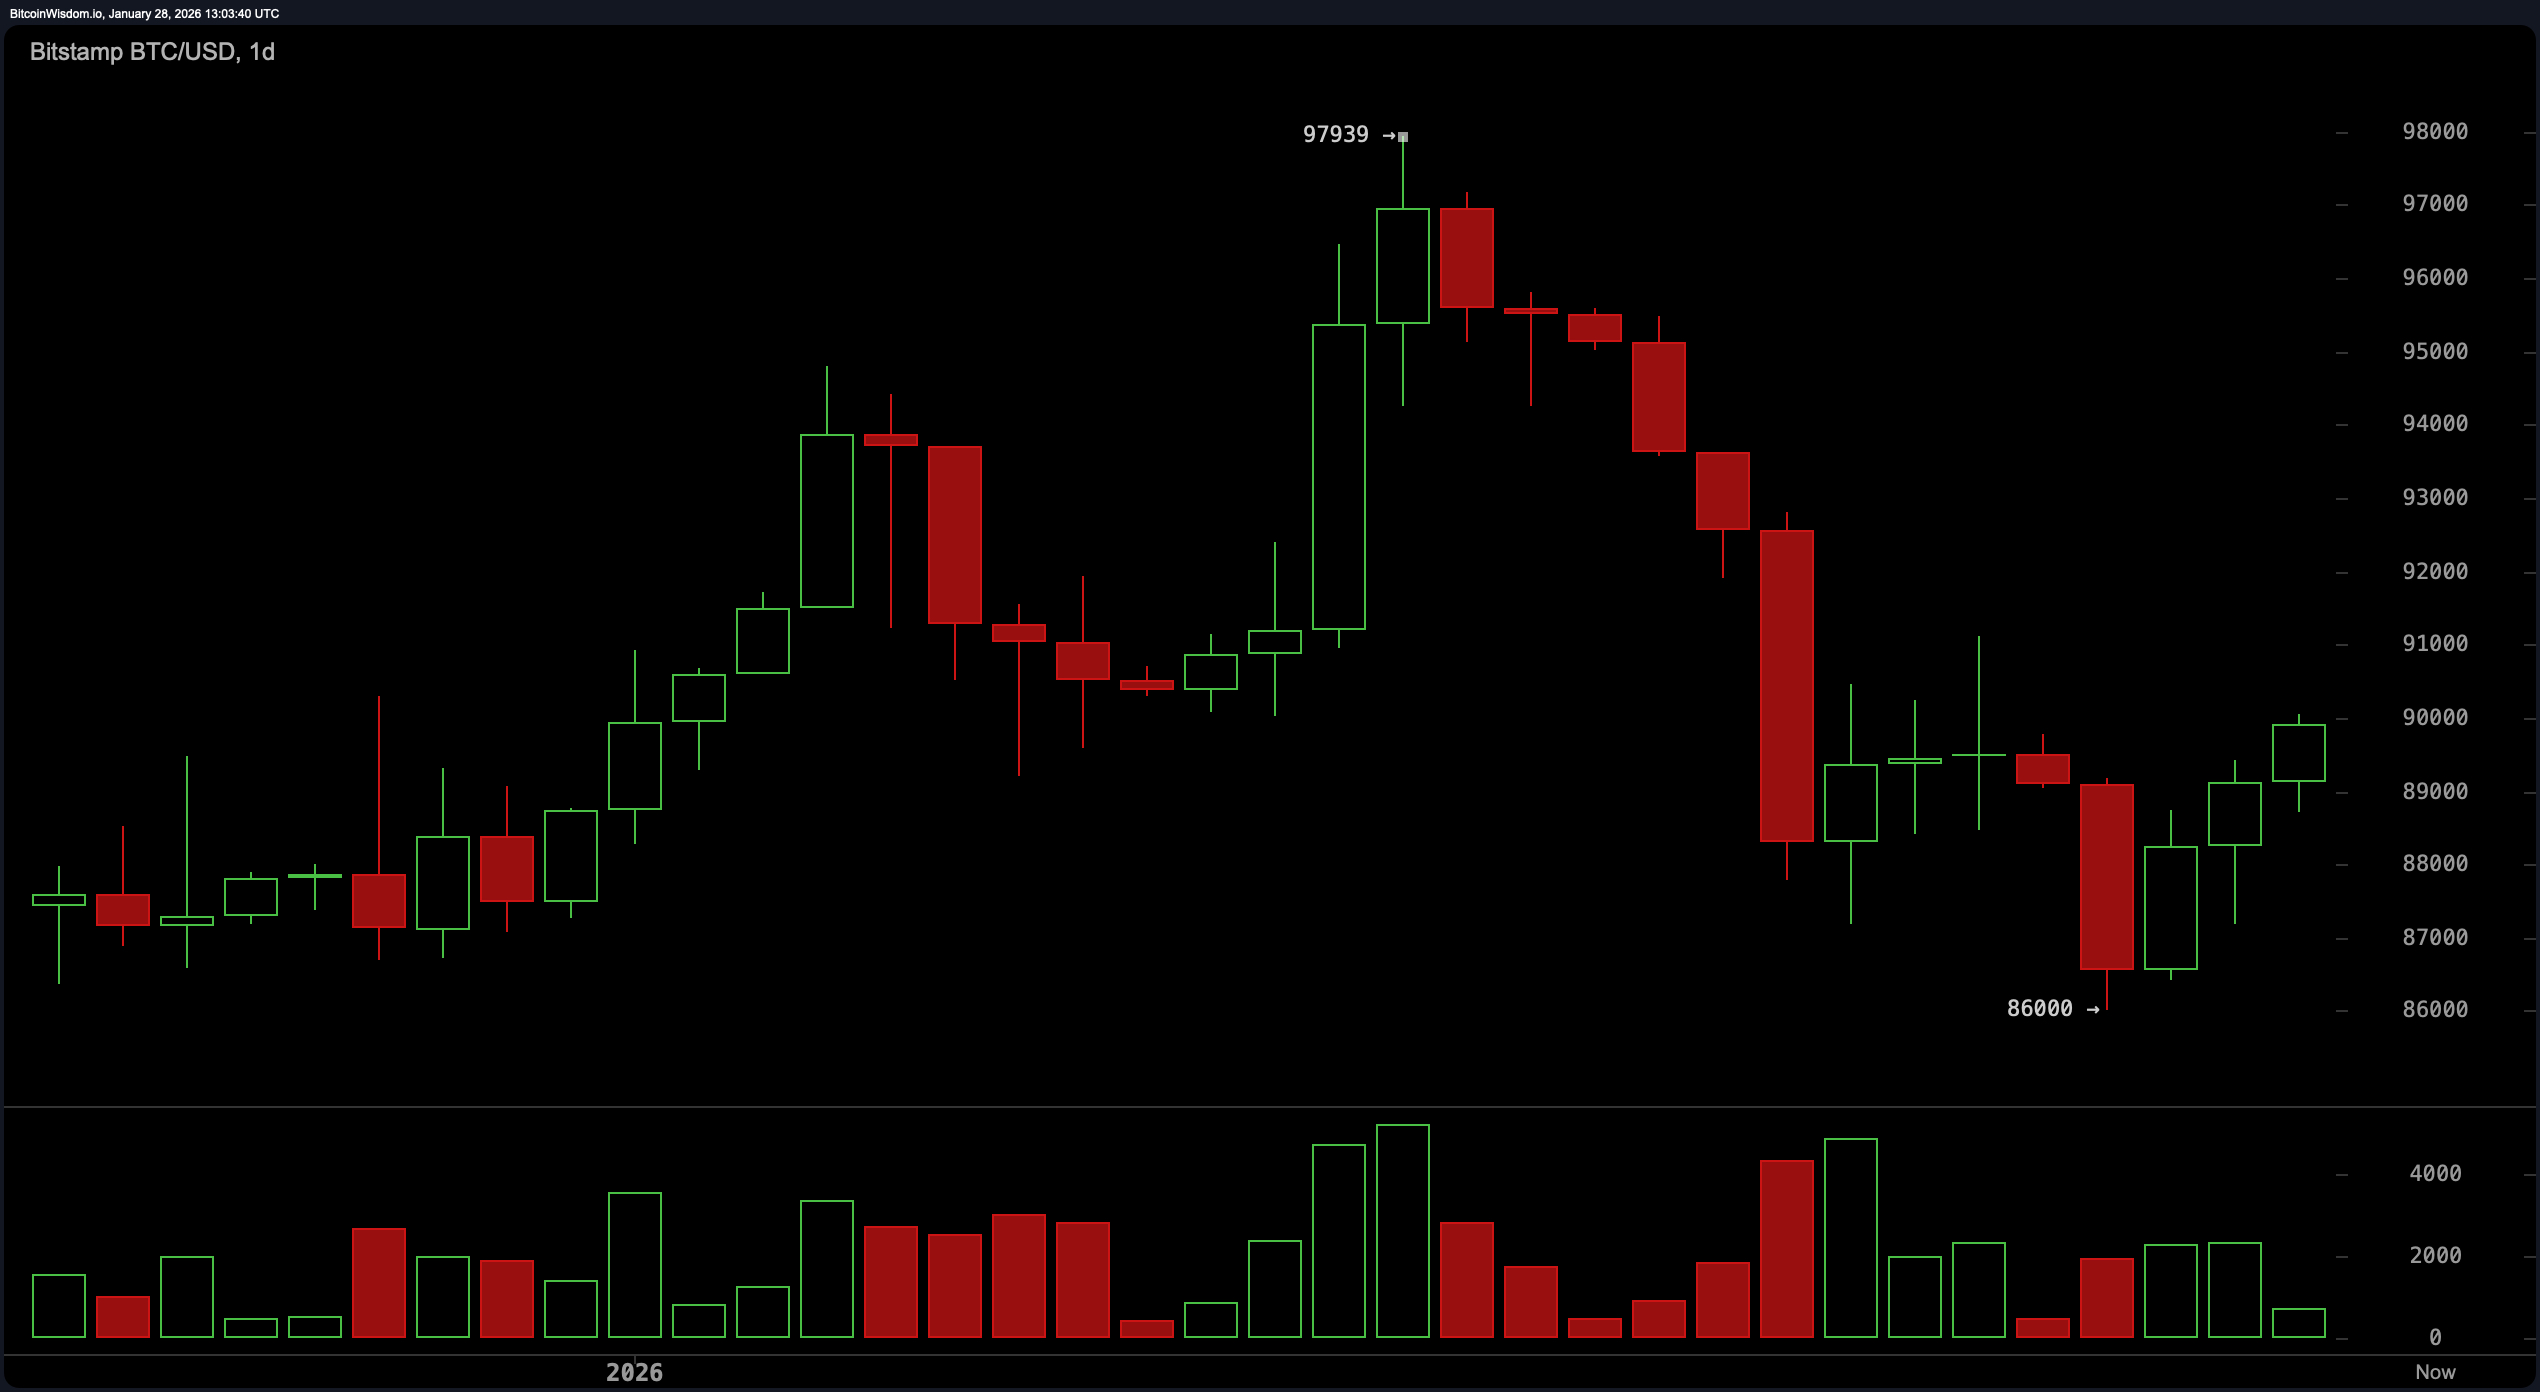
$BTC/USD 1-day chart via Bitstamp on January 28, 2026.
Zooming in on the 4-hour chart, Bitcoin appears to be taking a breather after its recent rally. The pattern since the Jan. 25 low of $86,000 resembles a rounded bottom, a classic form of gradual recovery. Prices have stepped up since then, but the resistance around $90,000 to $91,000 has acted like a velvet rope outside an exclusive club, letting some through, but not without hesitation. I can tell that the momentum is building up moderately, but the volume that you would expect from an explosive encore is noticeably lacking. This structure tests overhead barriers and may require a cautious approach.
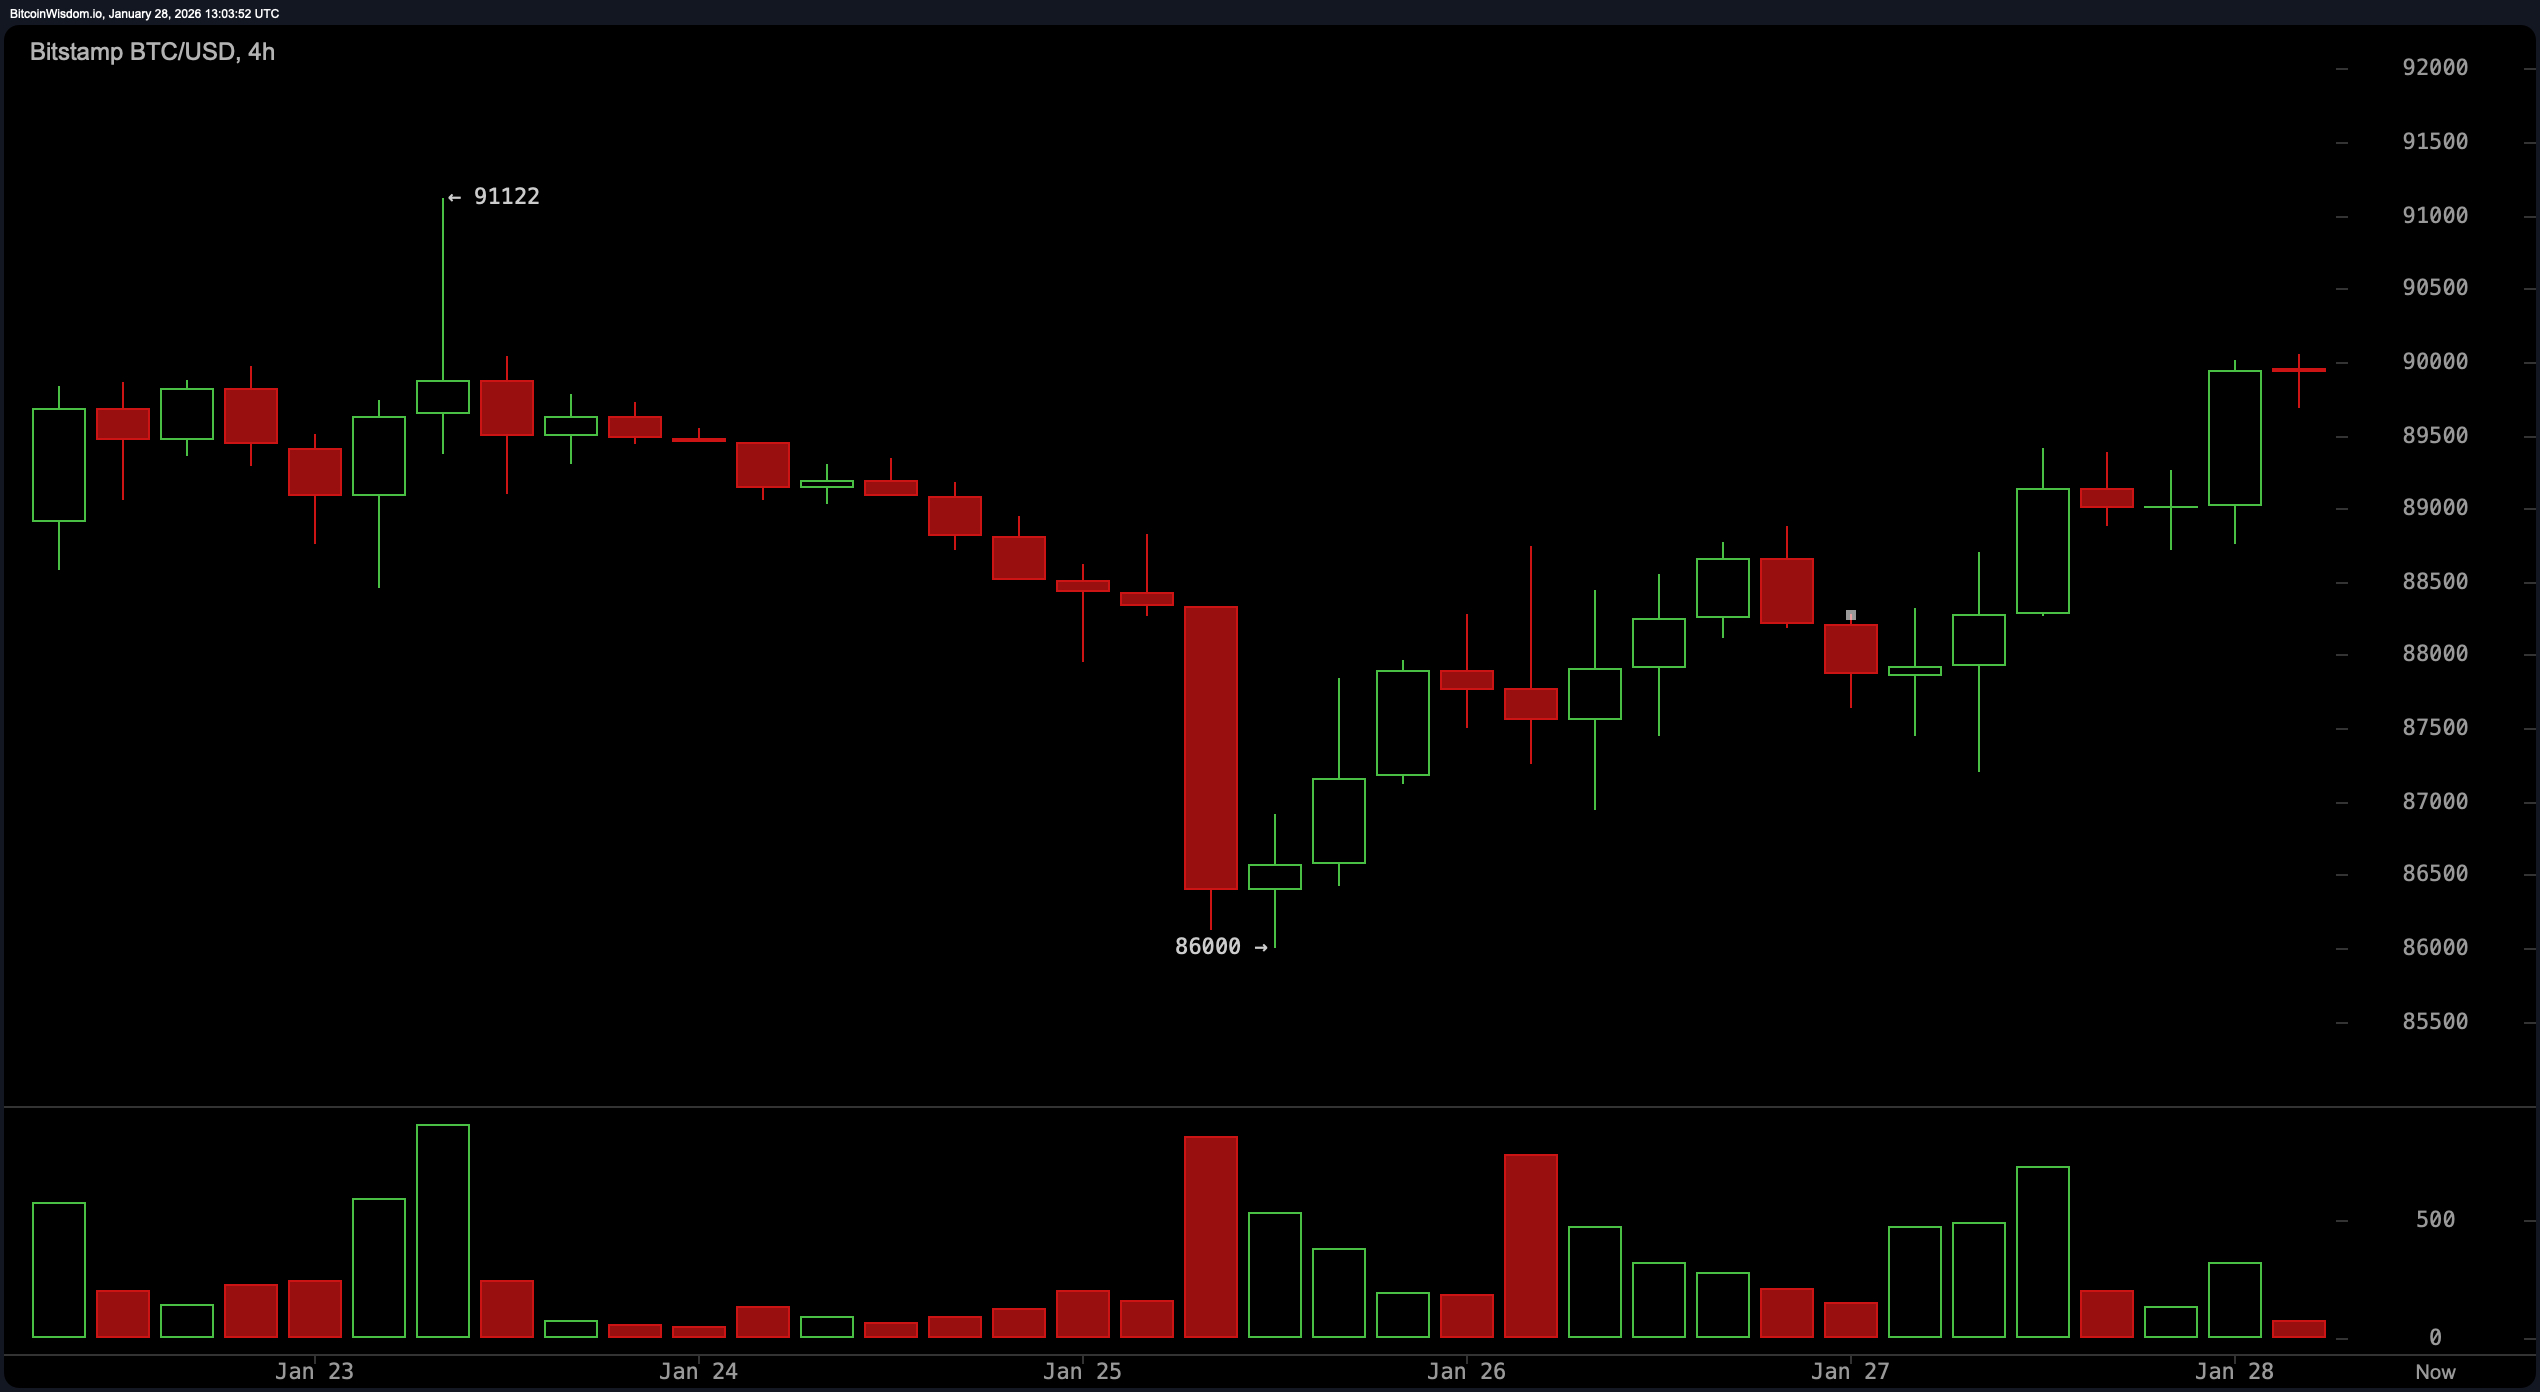
$BTC/USD 4-hour chart via Bitstamp on January 28, 2026.
On the hourly chart, Bitcoin’s action turns light-heartedly bullish. After bottoming at $87,197, the price not only made new lows and highs, but also formed a tight consolidation just below the recent high of $90,048. While momentum appears to be intact, volume contraction suggests a pause could be imminent, either due to a mild correction or Bitcoin taking a breather. Buyers are eyeing the $88,700 to $89,000 range, with the condition that a reversal candle is included as a garnish. Short-term targets are focused on just above $90,000, but a strong breakout could blow the ceiling tiles.
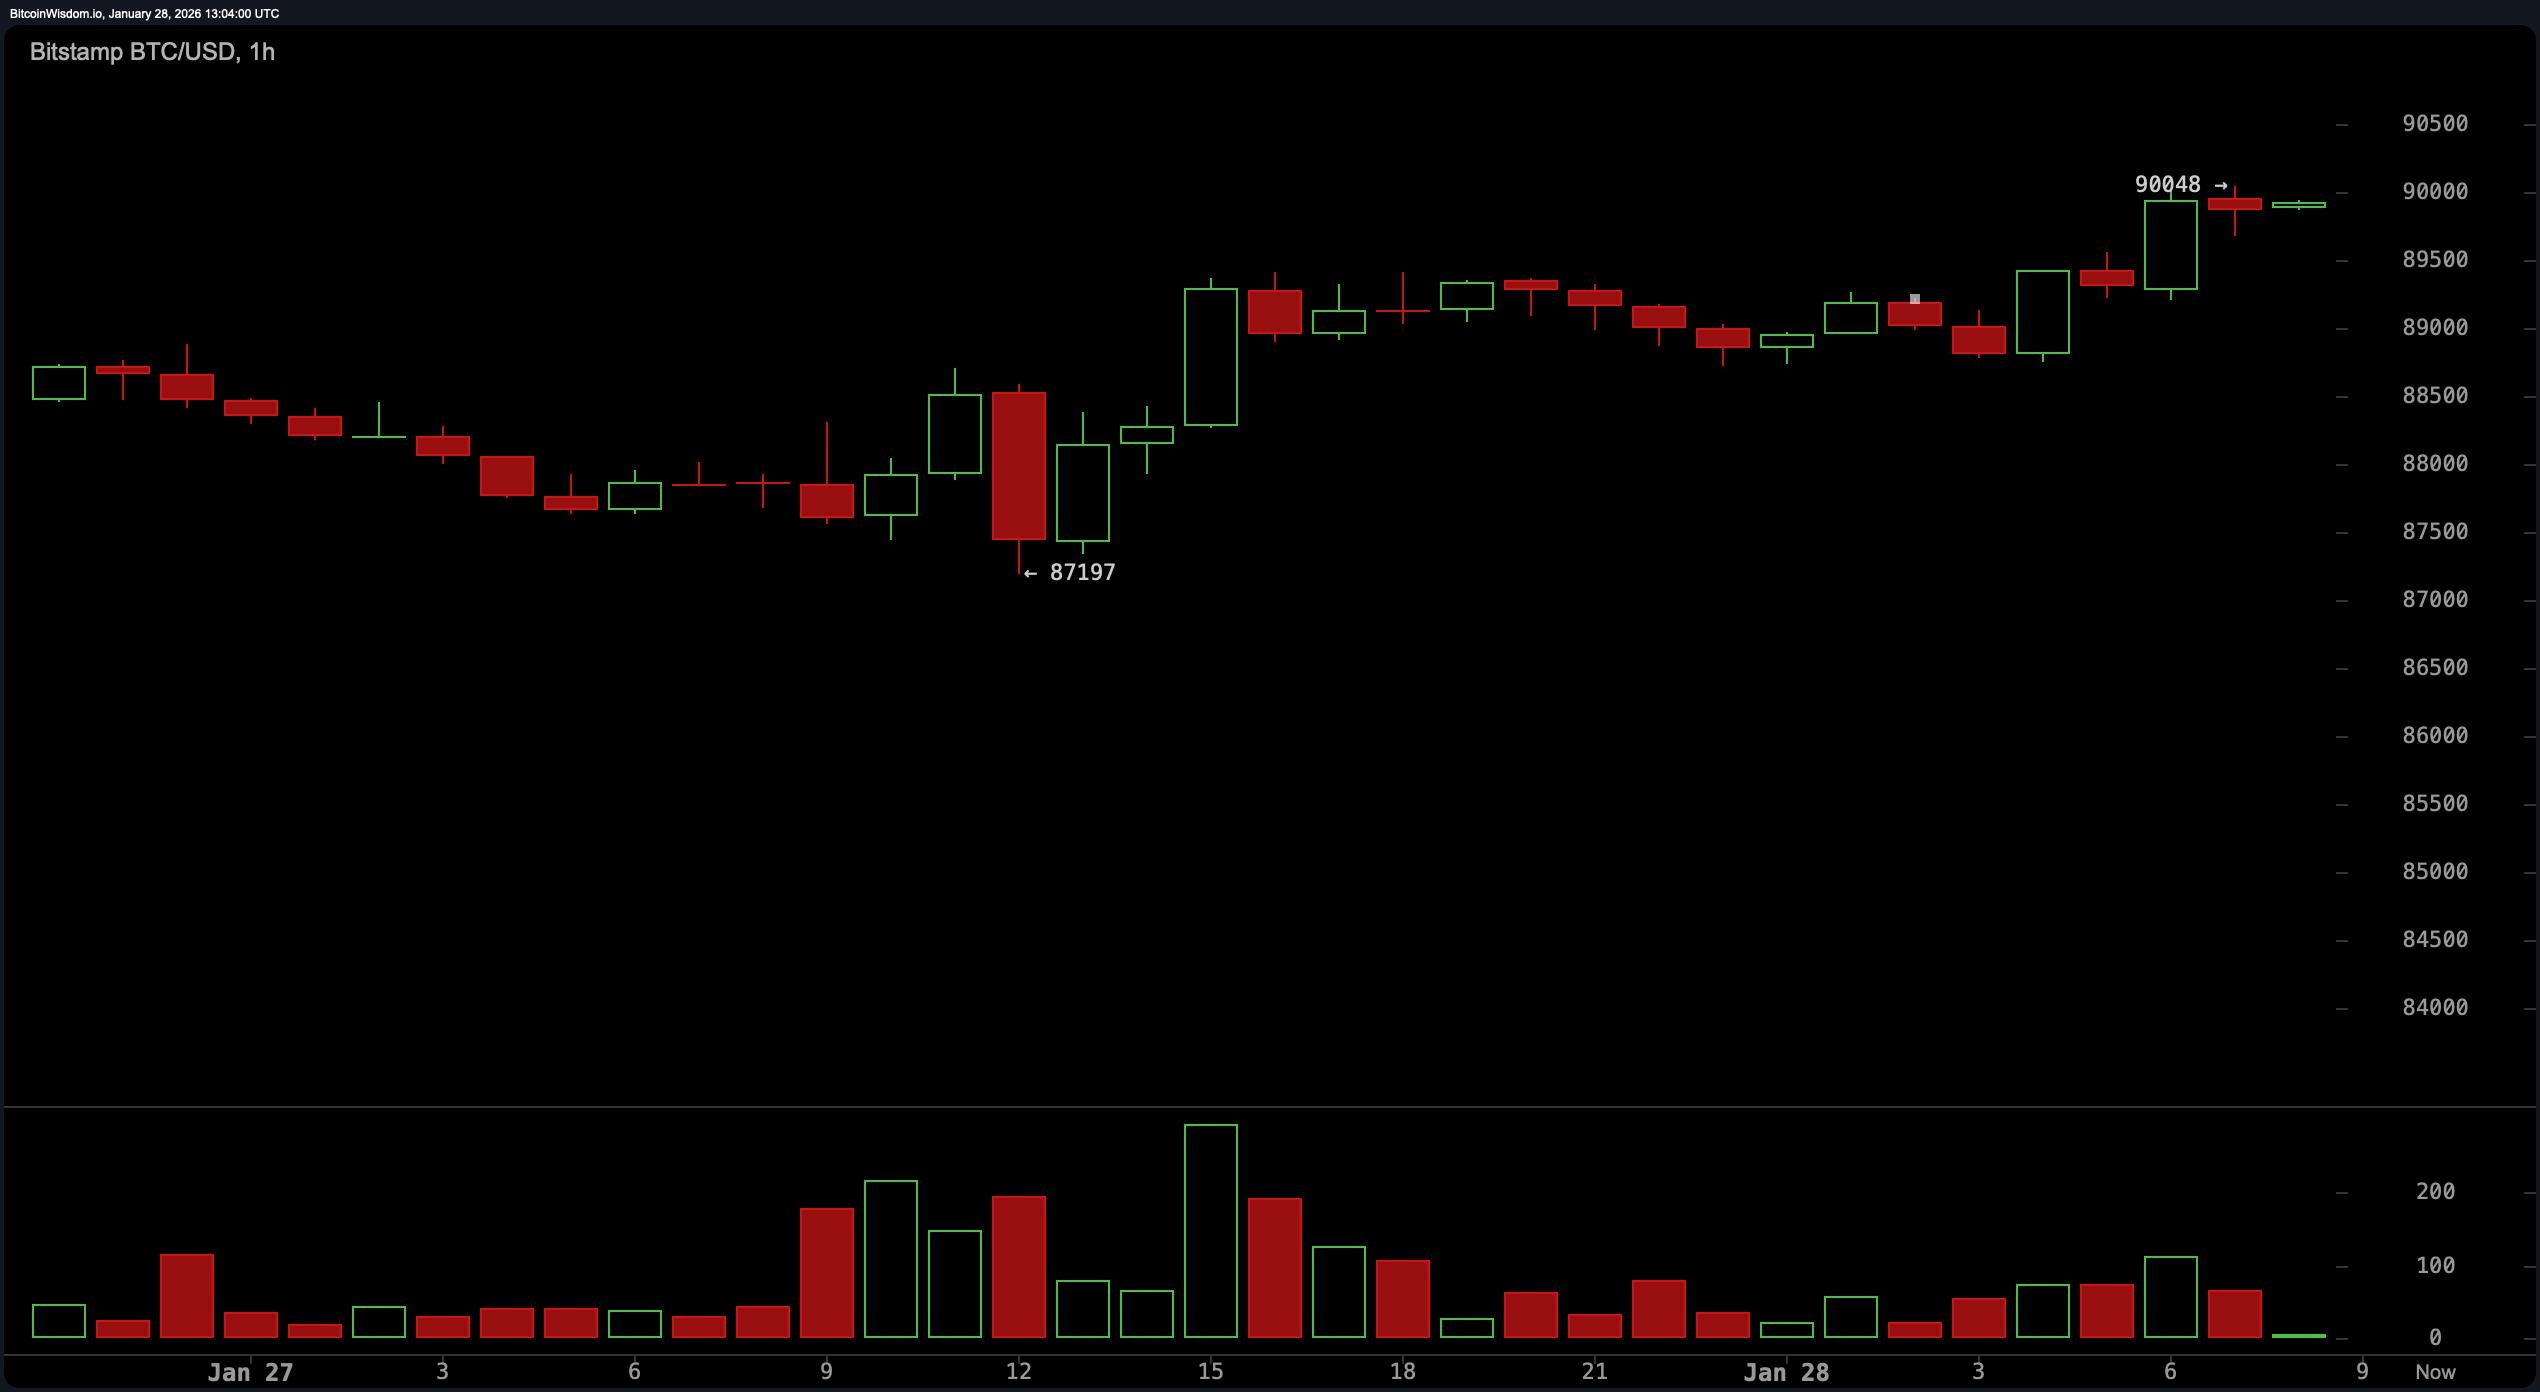
$BTC/USD 1-hour chart via Bitstamp on January 28, 2026.
The oscillators also don’t exert much power, and each plays coolly with a neutral stance. The Relative Strength Index (RSI) is at 48, neither overbought nor oversold, continuing the guessing game. The Stochastic Oscillator is down at 27 and still neutral, while the Commodity Channel Index (CCI) is hovering at a calm -49. Meanwhile, the Average Directional Index (ADX) maintains a weak trend signal at 24 and the great oscillator is underwater at -2,200. However, while momentum is showing a contrarian move in the green zone, suggesting underlying strength, the moving average convergence divergence (MACD) tells a completely different story, moving into bearish territory at -611.
The moving average is effectively at war with itself. Short-term indicators such as the 10-period exponential moving average (EMA) of 89,659 and the 10-period simple moving average (SMA) of 89,213 look positive. But the party ends quickly. The 20-period and 30-period EMAs and SMAs are all pointing down. The moving averages for the 50, 100, and 200 periods are also far above the current price movement, waving danger signals from a height that does not provide any reassurance. It’s a divisive decision at best, with short-term optimism and long-term caution, and neither side will back down without a fight.
Bullish verdict:
If you’re rooting for Bitcoin to move forward, the technicals provide enough breadcrumbs to follow. Bullish structure on the lower time frame, solid support at $86,000, and a spark of momentum indicate that the bulls are not out of breath yet. But to regain the spotlight, it will need to break through the $91,000 ceiling with volume and conviction.
Bear verdict:
Conversely, if this rally feels more like a sugar rush than sustained strength, you’re not alone. Momentum is weak, volume is cooling, and the higher timeframe moving average still casts a long shadow. If Bitcoin fails to push above $91,000, gravity could once again pull Bitcoin towards the $86,000 support for a reality check.
Frequently asked questions ❓
- What is the current price of Bitcoin? Bitcoin is trading between $89,884 and $90,136 as of January 28, 2026 at 8:00 AM ET.
- What is the market sentiment regarding Bitcoin today?Technical indicators indicate mixed momentum with major resistance at $91,000.
- Could Bitcoin break above $91,000 soon?Only a strong volume breakout can push Bitcoin past its resistance.
- Where will Bitcoin’s next support level be?Following the recent pullback, the major support remains near $86,000.