


Iranian Parliament Speaker Mohammad Bagher Ghalibaf posted an impressive market commentary on X before the recent wild swings in futures prices. Adding fuel to the online propaganda proxy war being waged on social media, comments lean toward accusations of insider trading in polymarket war bets.
“So-called pre-market ‘news’ and ‘truth’ are often just a setup for profit-taking,” he writes. “If they go up, go short; if they go down, go long.”
After that, the market traded pretty much as described.
The Kovesi letter tracks this movement over time, with S&P 500 futures beginning sharply lower Sunday night, but recovering by the evening and extending their gains after President Trump said on Truth Social that “significant progress” had been made on the Iran peace talks.

MarketWatch confirmed the legitimacy of an account that publicly offered contrarian trading advice to U.S. investors just before futures trading opened on Sunday, and Barron’s said Monday’s rebound was another shock to early morning markets caused by President Trump’s social media messages about Iran.
President Trump’s posts about Iran have repeatedly changed the short-term pricing of stocks, oil, and cryptocurrencies.
A week earlier, markets had soared after President Trump said a settlement with Iran was near.

Bloomberg reported that billions of dollars in futures contracts for oil and stock indexes changed hands just before President Trump’s post on Iran caused oil prices to drop and stock prices to rise, while the Wall Street Journal reported that futures trading surged ahead of Trump’s new message, which drew scrutiny from across trading desks.
It is against this backdrop that the economic outlook for the coming week is set.
The market faces a geopolitical risk premium for oil, an increased likelihood of slowing growth, and political communication channels currently serving as immediate inputs for pricing.
Monday’s movement between assets makes the interaction evident.
S&P 500 futures rose further after President Trump said the US was in “serious talks” with a “new, more rational regime” in Iran.
The same message cycle also includes a threat to “completely destroy” Iran’s energy and water infrastructure if a settlement is not achieved.
A combination of conciliatory language on the one hand and escalation risks on the other shaped the session. The Wall Street Journal reported that WTI rose above $100 a barrel and Brent above $108, but then Brent soared above $116 as the conflict escalated.
Investors are now dealing with diplomacy and turmoil simultaneously, with energy channels remaining the main route to inflation, interest rates and growth.
Bitcoin enters this equation with one structural advantage over every major risk asset in the United States.
All trades occur throughout the weekend, through Asian time, and throughout the period when Wall Street’s core spot market is closed.
Bitcoin tracks the same macro shocks as stocks, forming its own pattern while Wall Street was offline
The value of this series of Bitcoins is determined by timing.
Because it trades continuously, it acts as a live macro market when US stocks are closed.
This gives you two roles at once.
It reacts to the same geopolitical inputs that drive the S&P 500, and can also show you in real time how those inputs are absorbed outside of U.S. cash trading hours.
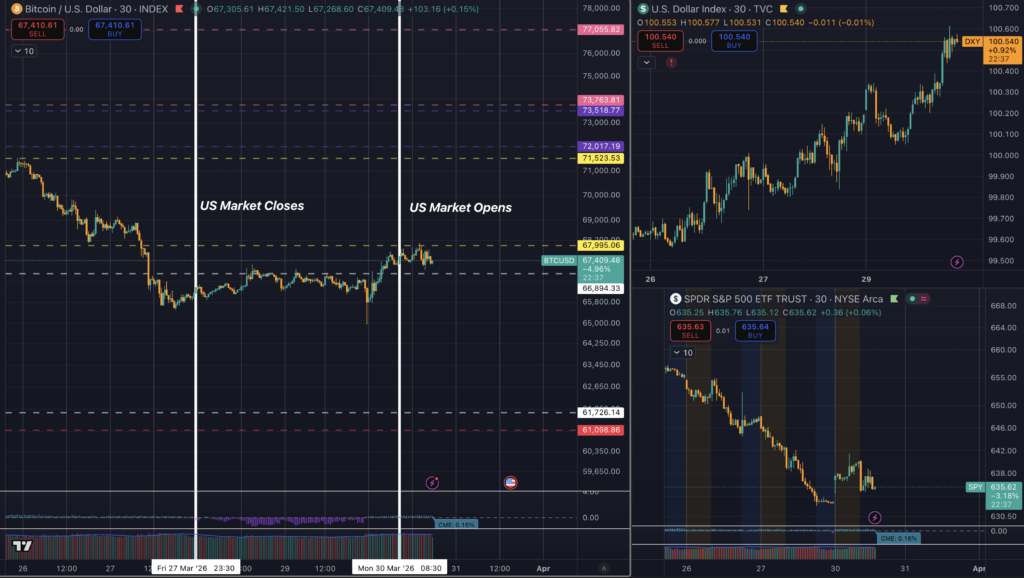
The chart pattern surrounding this latest Iran-Trump sequence clearly shows that distinction.
Bitcoin sold off heavily over the weekend into the period around the close of US trading, then entered a long stability zone while US stocks were offline.
Bitcoin prices fell to a close on March 27th, then spent most of the closing period in a wide range in the mid-to-high $66,000s before consolidating at Monday’s U.S. open price.
The S&P’s intraday sequence was sharper and more discrete.
Bitcoin’s sequence was faster, more continuous, and more gradual.
This broad structure is consistent with a broader market report from earlier this month.

When the first attack cycle began on Saturday, Bitcoin, the first liquid asset to price the Iran war, fell 8.5% while traditional markets were closed.
Over the next few days, Bitcoin fell to $67,300, but rose after President Trump said the United States had begun talks with Iran. Bitcoin then rose above $71,000 as war concerns subsided.
Bitcoin also fell below $68,500 last week as new mixed messages from Iran roiled the market. There is a simple interpretation.
Bitcoin has traded throughout the conflict as a macro-sensitive asset, with oil, interest rates and political signals shaping its direction.
The latest chart adds even more sophisticated points.
Bitcoin mirrors the S&P at the administration level, with both assets falling during geopolitical stress and firming up when President Trump’s rhetoric shifted to dialogue. Within that system, paths diverged.
During the period when the S&P spot market was closed, Bitcoin spent more time absorbing losses and building foundations than extending a strong bailout.
A visible lift approached the US Open.
This timing suggests that Bitcoin served as a pre-open sentiment gauge for Monday’s stock rally, with the strongest rally emerging in US trading starting around 00:01 UTC on Monday.
The US dollar index also rose steadily through Monday, lending further texture to the move.
A strong dollar typically tightens the backdrop for BTC and other risk assets.
Bitcoin’s ability to stabilize and rise alongside the rise in DXY points to a move driven by re-pricing around Iran and Trump’s message, supported by positioning and bailouts, with less help from the monetary side of the macro equation.
24/7 signals from Oil, Payrolls, Retail Sales and Bitcoin define the week ahead
A macro calendar centered on crude oil has been released.
The Wall Street Journal reported that WTI has risen about 50% since the US and Israel began bombing Iran in late February.
Axios wrote that the OECD now expects U.S. inflation to reach 4.2% in 2026, 1.2 percentage points higher than expected in December, as wars and energy shocks changed the path of inflation.
This makes this week’s economic announcements an intensive stress test.
Each of these reports includes a second layer. Investors will judge growth through the lens of crude oil. This increases pressure on all risk assets, including Bitcoin.
Bitcoin has already outperformed many major assets during times of stress.
The Latest Week Ahead setting is narrower in scope and more practical.
Bitcoin serves as a high-beta macro instrument during geopolitical re-pricing and as a 24/7 spot for sentiment changes that occur outside of US cash hours.
This combination makes Bitcoin extremely useful right now.
If President Trump posts over the weekend, Bitcoin will be the first to trade.
If oil spikes during Asian time, Bitcoin will absorb that injection before New York.
If a diplomatic shift emerges early in the morning, Bitcoin could begin to reassess its risks before the S&P spot market gets the vote.
Here are this week’s unanswered questions.
President Trump’s posts on Iran have shown enough impact on the market to count as a functioning conduit, and traders are closely monitoring these moments, including spikes in trading activity that arrived shortly before some posts.
The market still needs confirmation from events on the ground, oil and data from the US.
Bitcoin offers one of the clearest real-time views of how investors are handling its uncertainty.
Recent patterns suggest a three-stage sequence of initial risk repricing, stabilization through closure, followed by a more solid path toward reopening the United States.
If this sequence repeats during the next round of Iran-related messages, Bitcoin’s weekend and overnight movements will provide one of the earliest clues as to whether traders see another temporary relief move forming, or whether an energy shock is dominating the week.
(Tag Translation) Bitcoin