Bitcoin has entered a delicate phase. The stock is testing the lower end of its recent rally after a significant retracement from its highs in late 2025. The market structure currently suggests that a potential accumulation zone is forming, and short-term fluctuations are contained within an expansion channel.
However, volatility is still rising and the upcoming sessions are $BTC If further downside materializes above $60,000 or towards the support cluster below $50,000, a bottom could form.
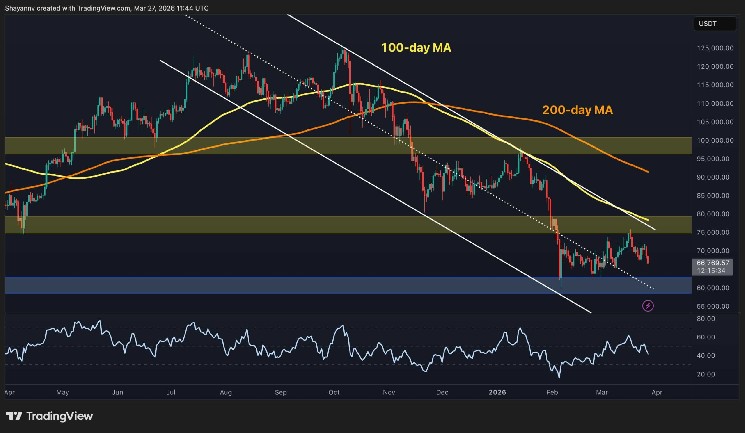
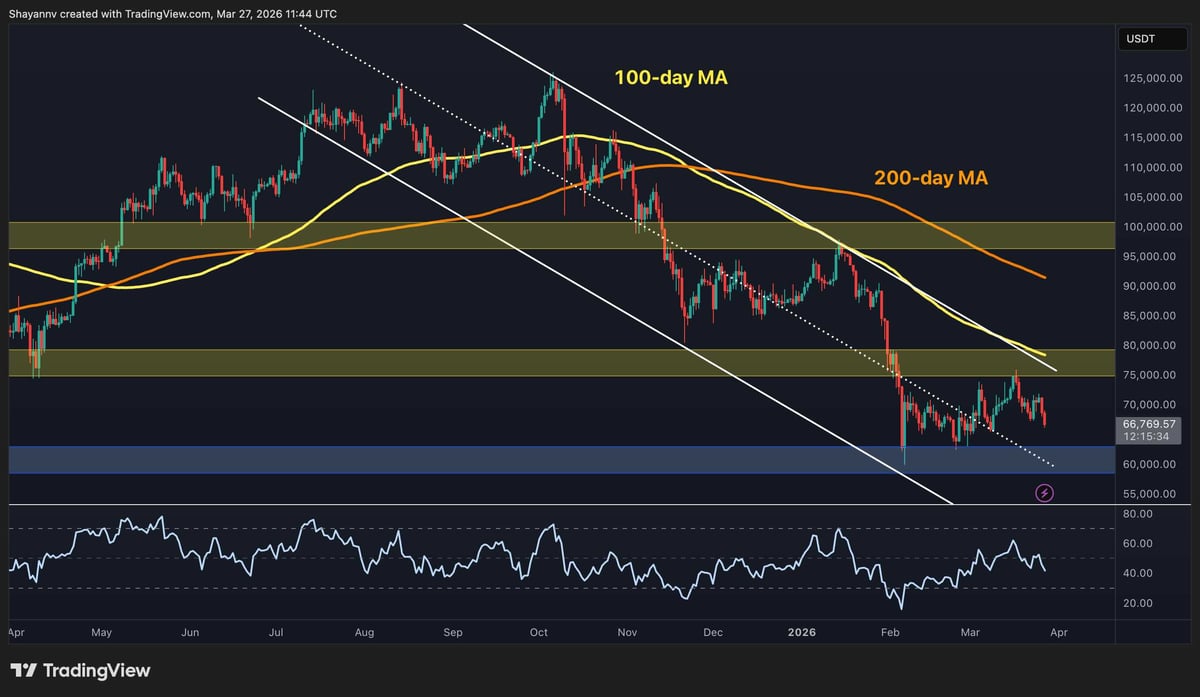
Bitcoin Price Analysis: Daily Chart
In the daily time frame, $BTC Shows mixed signals. Price remains below the 100-day moving average (yellow, ~$80,000) and 200-day moving average (orange, ~$90,000), within a broad descending channel. This confirms a medium-term bearish trend. However, the current consolidation has formed just above a strong support zone around $60,000, which is consistent with previous areas of liquidity and demand.
The RSI has also recovered from deeply oversold levels near the bottom of the range, but has fallen again following recent rejection from the $75,000 resistance zone. Therefore, the critical $60,000 demand zone is likely to be tested again in the coming days as prices accelerate. $BTCThe short-to-medium term trend of will largely depend on the market reaction at this level.
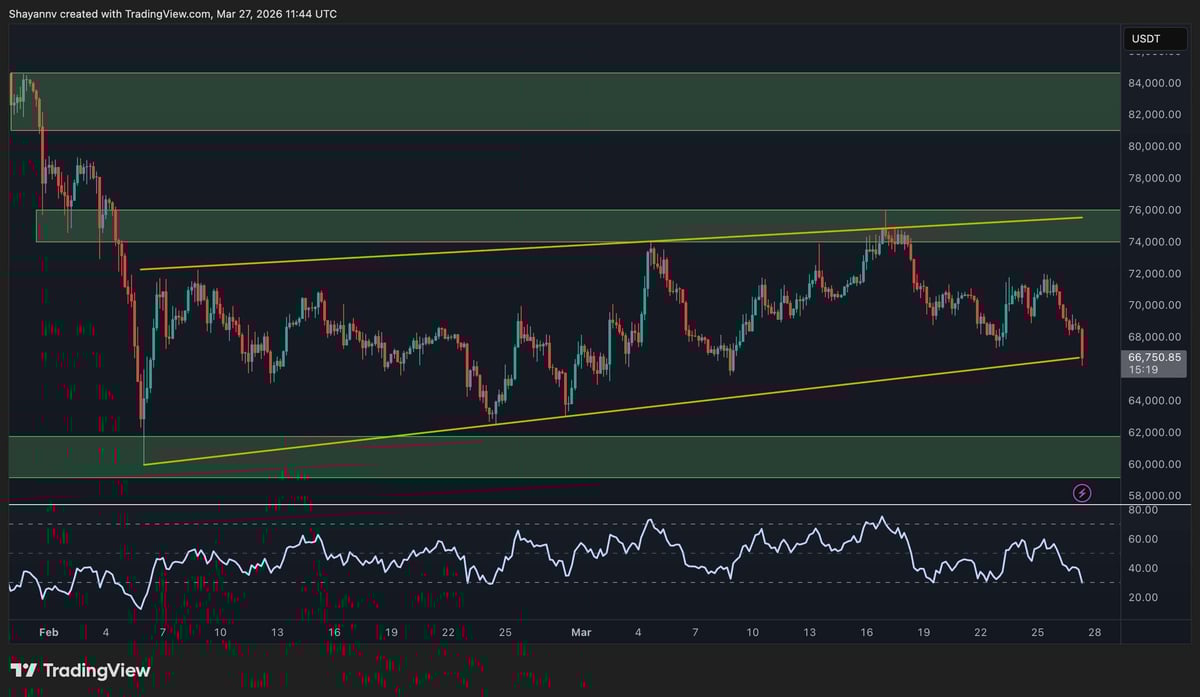
$BTC/USDT 4 hour chart
If we zoom in on the 4-hour chart, we can see the following: $BTC It is forming an ascending channel and resembles a large bearish flag. The asset has also been consolidating in a wide range between $60,000 and $75,000 for the past few months, constrained by both channel boundaries and key support and resistance levels.
The recent rejection from the $75,000 level is more evident on the 4-hour chart as the short-term market structure is clearly shifting bearish after failing to breakout above the channel and horizontal resistance area. This has resulted in a fairly steep drop towards the lower end of the channel in recent days, and it is currently on the verge of collapse.
The near-term outlook does not look good for buyers as the RSI is also at low levels close to oversold territory, so a breakout of the channel with momentum could lead to further decline towards the $60,000 zone and make the market nervous again.
On-chain analysis
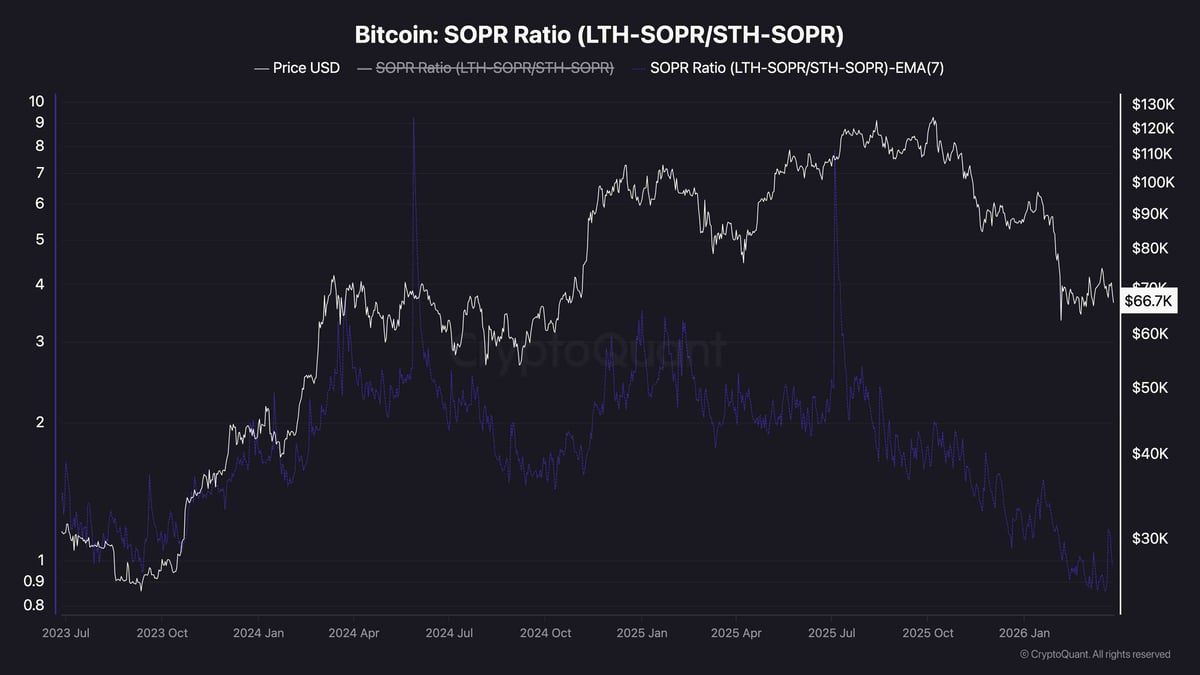
On-chain metrics highlight important aspects of the current cycle. The LTH-SOPR/STH-SOPR ratio has declined to a level below 1, reaching values comparable to those observed during the accumulation phase at the end of the last market cycle in 2023.
For context, the LTH/STH SOPR ratio measures the profit realization of long-term holders (LTH) relative to short-term holders (STH). Therefore, a ratio less than 1 indicates that LTH is selling at a loss or break-even, while STH is under significant pressure.
Historically, such weak readings have coincided with market bottoms and periods of strong buildup. This suggests that the current decline in the index may reflect capitulation by a weaker hand while more patient investors accumulate capital. $BTC A sustained range could lay the foundation for the next bullish leg.
However, this signal should also be accompanied by some positive price action soon, as even the strongest hands cannot hold out forever amid massive drawdowns.