


Ethereum price continued its strong downward trend this week, reaching its lowest price since May last year.
summary
- As the crypto market crash accelerates, Ethereum price has fallen to a key support level.
- Its liquidation value has soared to its highest level in recent months.
- Ethereum’s weighted funding rate has fallen to its lowest level in October.
Ethereum ($ETH) token fell 60% from its all-time high to a low of $1,768. The setback coincided with a broader crypto market crash as retail investors and some institutional investors dumped cryptocurrencies.
U.S. investors sold $149 million worth of Ethereum ETFs this year, according to data compiled by SoSoValue. January marks the fourth consecutive month that these funds have reduced assets.
Additional data shows that the Ethereum bull market has largely liquidated as the crash continues. Nearly $2 billion worth of Ethereum positions have been liquidated since January 31st, the highest amount since October 10th, when more than $3.8 billion worth of positions were liquidated.
Most importantly, the weighted funding rate turned negative, falling to its lowest level since October 10th. A negative funding rate indicates that investors are expecting the coin to decline. It occurs when shorts pay out long positions in the perpetual futures market.
You may also like: Predict Cardano price ahead of CME ADA futures launch on February 9th
On the positive side, the Ethereum network is doing well, with Nansen data showing a spike in transactions, fees, and active addresses. Ethereum has processed 70 million transactions in the past 30 days, and the number of active addresses has increased by 42% to over 15 million.
It also holds top market share in each area of the cryptocurrency industry, including stablecoins, decentralized finance, and tokenization of real-world assets. These fundamentals could help fuel a long-term recovery.
Ethereum price technical analysis
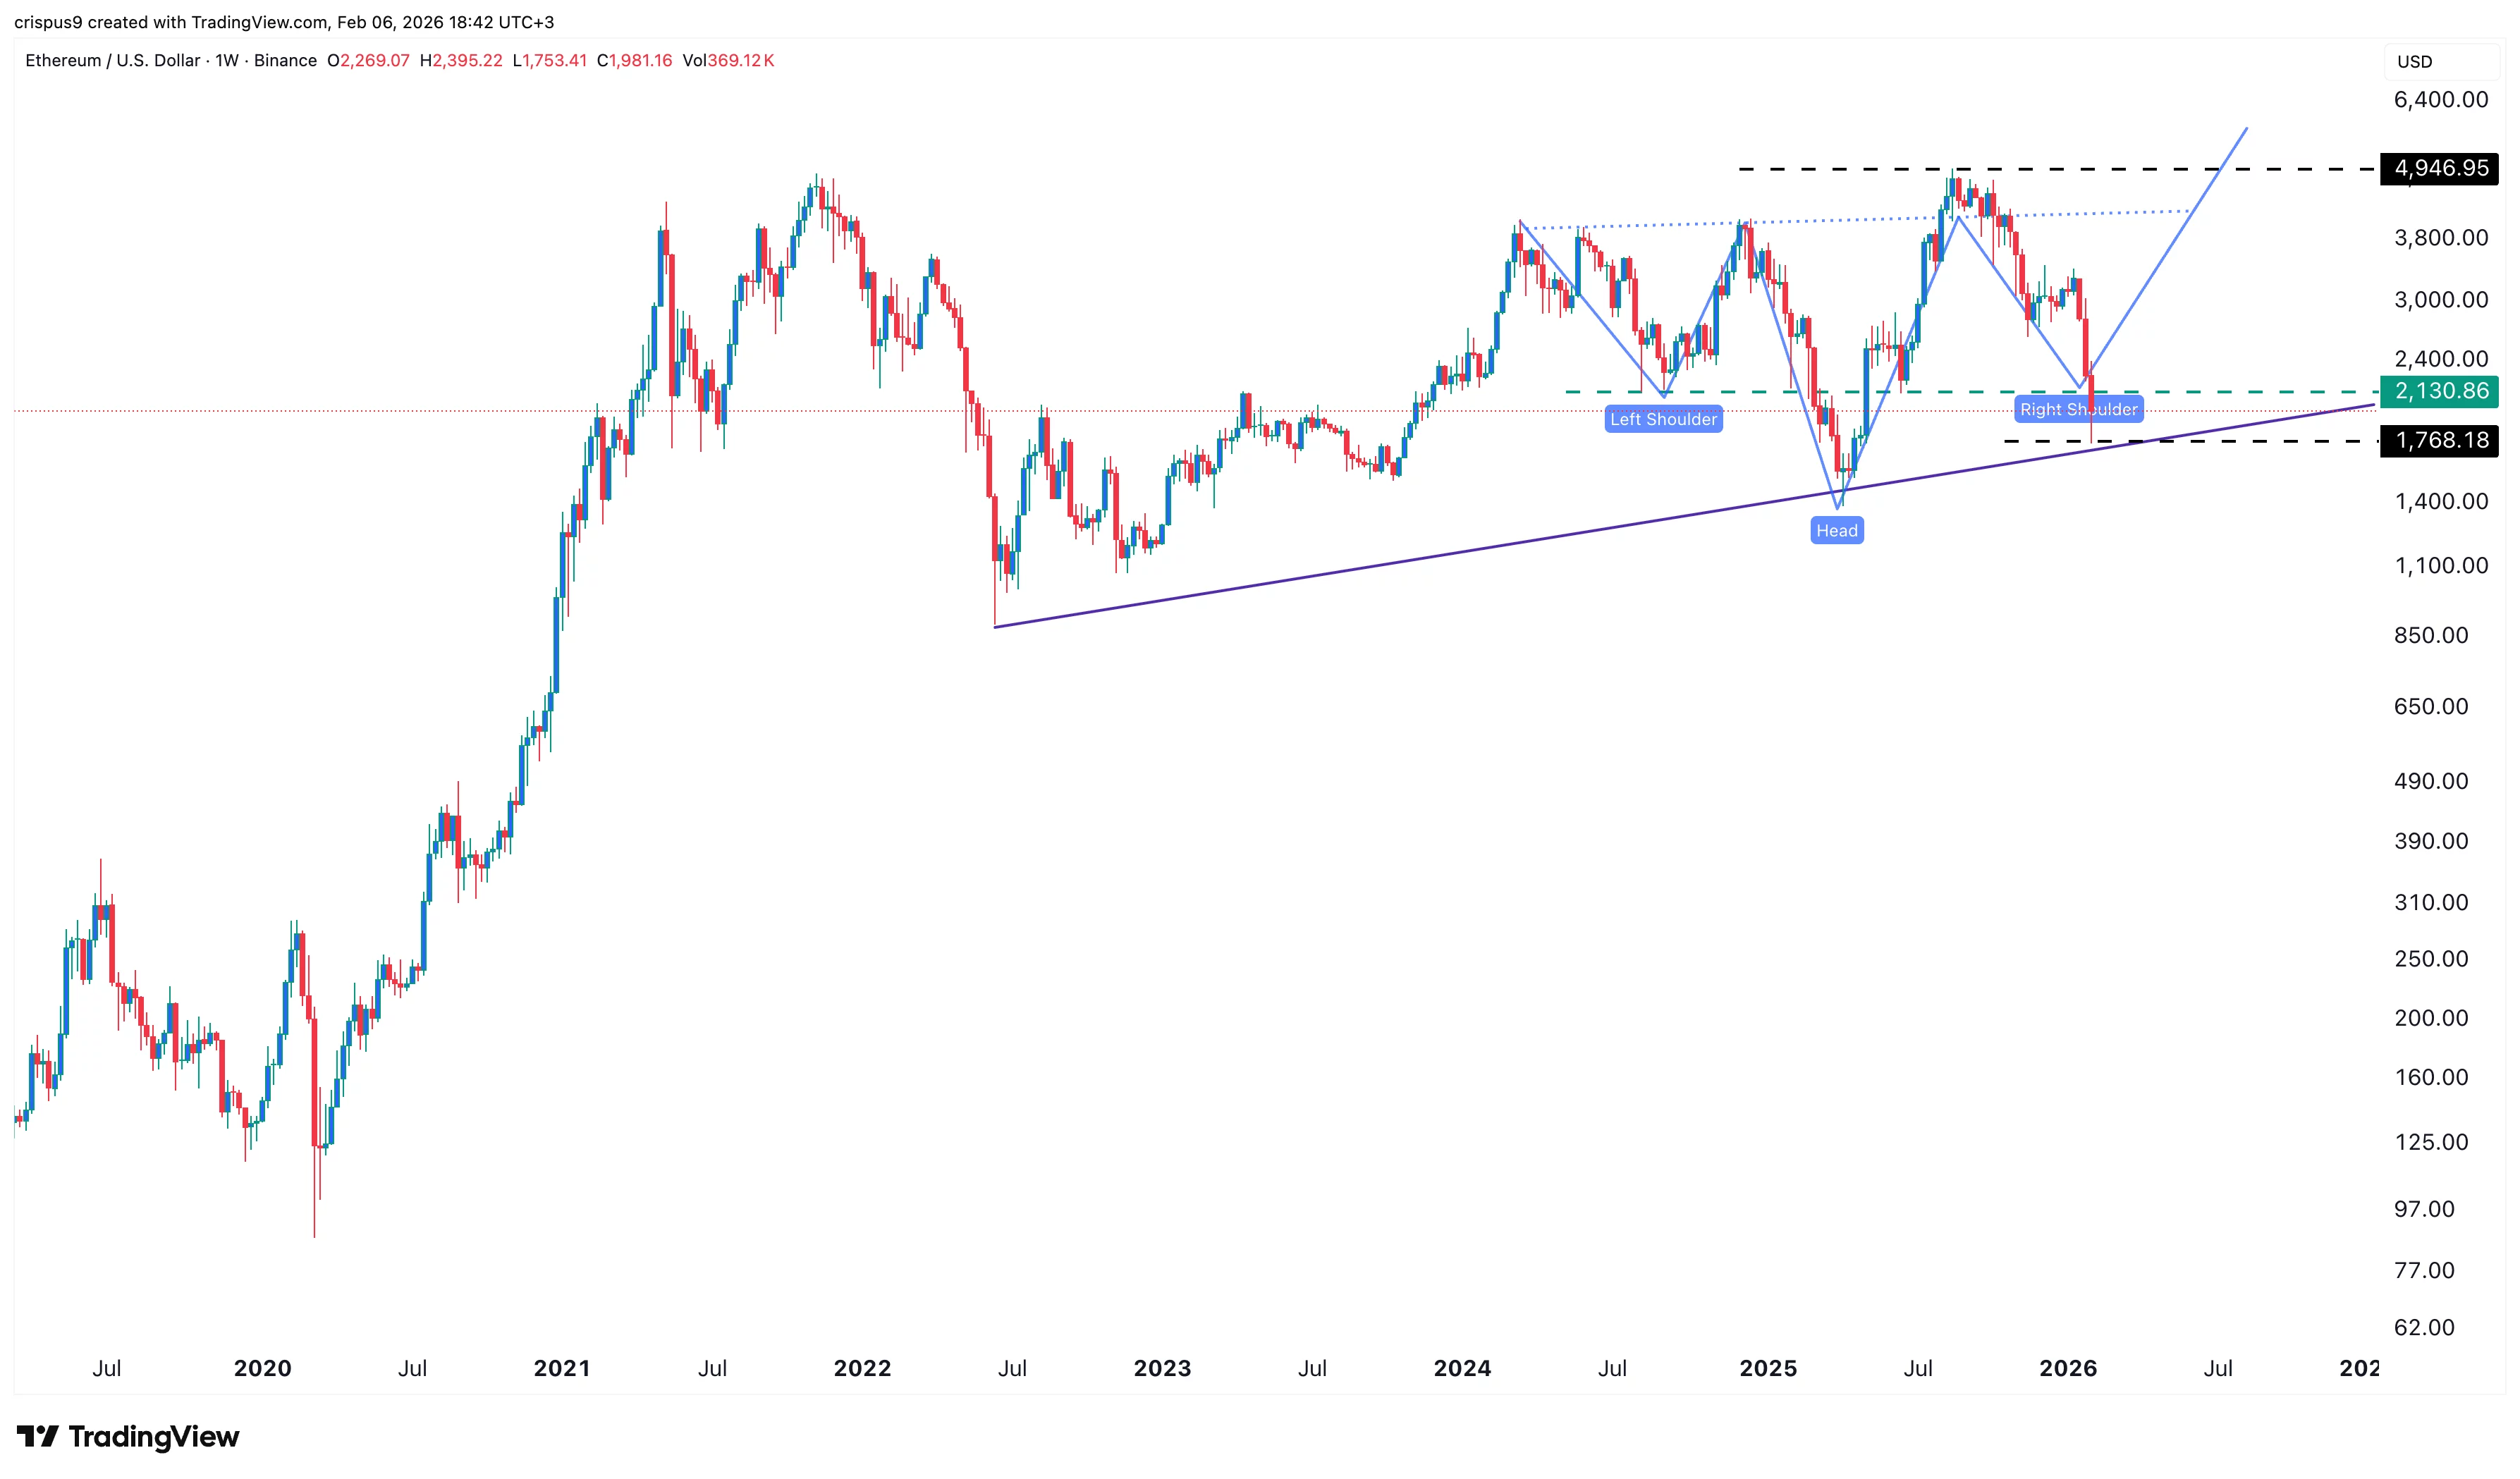
$ETH Price list |Source: crypto.news
Looking at the weekly chart, $ETH Prices have fallen in the past few months. The stock has fallen from its all-time high of $4,950 to today’s low of $1,7686. That low point was notable because it coincided with an uptrend line connecting the lowest levels of June 2022 and April of last year.
Price was also important because it was near the left shoulder in an inverted head-and-shoulders pattern. This pattern is one of the most common bullish reversal signs in technical analysis.
Therefore, if the weekly close exceeds $2,130, a reversal could occur and reach $3,000. On the other hand, a close below the $1,768 support will invalidate the bullish outlook.
You may also like: China officially decides to completely ban virtual currency trading and RWA tokenization