


Ethereum’s price has fallen 30% from this year’s high and entered a bear market. ETH is trading at $3,475, forming a risky pattern that could push it further down over time as institutional demand wanes.
Ethereum price forms death cross pattern
Copy link to section
The daily timeframe chart shows that the price of Ethereum has been in a strong downward trend over the past few months, rising from a high of $4,950 in August to a current high of $3,473.
Ethereum is currently forming a very bearish death cross pattern. This occurs when the 50-day weighted moving average and the 200-day weighted moving average (WMA) intersect. This pattern often leads to further declines.
This coin also forms a head-and-shoulders pattern with a sloping neckline. Most recently, it formed a bearish flag pattern consisting of a vertical line and a channel.
Ethereum price fell below the 38.2% Fibonacci retracement level at $3,580. A break below this level typically leads to further downside with the potential to reach the 50% and 61.8% retracement levels.
Therefore, the most likely Ethereum price prediction is bearish, with the next major support level being the psychological level at $3,000. The bearish outlook will be invalidated above the $3,800 death cross point.
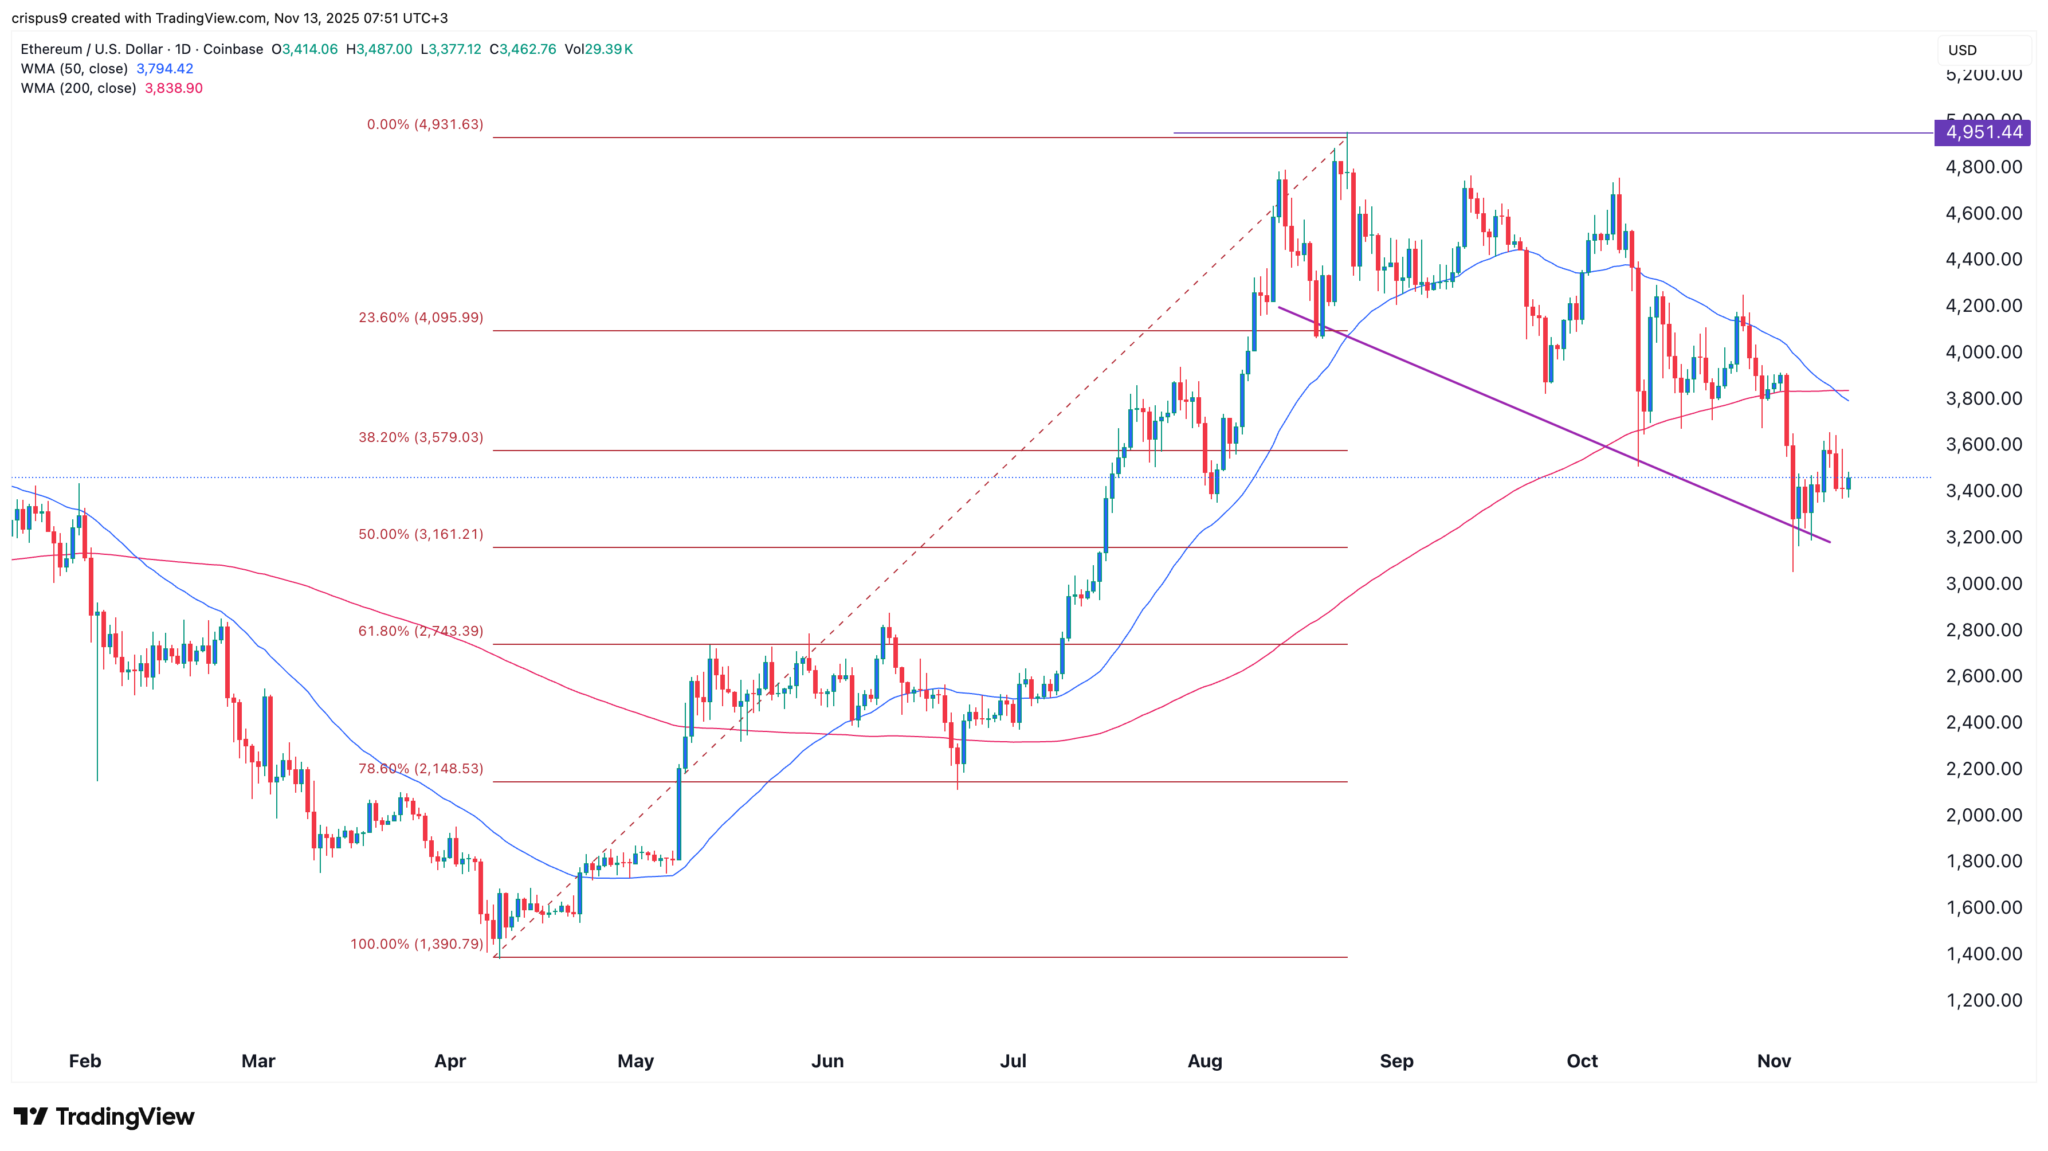
ETH price chart |Source: TradingView
Why ETH price is falling
Copy link to section
There are several underlying reasons why the price of Ethereum is plummeting today. First, the fundamentals are deteriorating, with total value locked (TVL) decreasing by 16% over the past 30 days to $157 billion, according to data compiled by DeFi Llama. TVL is an important number that examines the amount of money introduced into a smart contract.
Further data compiled by Nansen shows that the number of active addresses and transactions on Ethereum has fallen sharply over the past few months. There were 45.2 million transactions made within the network in the past 30 days, a decrease of 23%. Its fees fell 42% to $27 million, and active addresses fell to 8.2 million.
In contrast, other networks such as Tron and BNB Chain are doing well, with transactions increasing by 38% and 35%, respectively, over the past 30 days.
Ethereum’s price also plummeted due to the continued performance of the exchange traded fund (ETF) market. According to the data, these funds had outflows of $507 million last week, compared to $107 million this week.
In terms of assets, BlackRock’s ETHA ETF leads the pack with $13.8 billion, followed by Grayscale’s ETHE with $3.38 billion.
Ethereum’s price has also plummeted as treasury companies face major challenges. Tom Lee’s BitMine stock has fallen from $160 in July to $40 today, and SharpLink has fallen from $123 in May to $11 today.
The collapse of Ethereum government bonds will be a big blow to the coin, as it means that the amount of tokens acquired will decrease in the future.
As the open interest continues to fall, the price of Ethereum is also falling. This has fallen from $70 billion in August to $39 billion. This open interest plummeted after a major liquidation event in October, where $3.8 billion worth of positions were liquidated within a day.
Ethereum’s weighted funding rate has continued to move sideways over the past few months, indicating that liquidity has dried up significantly over the past few months.
Further data shows that investors are unstaking Ethereum coins. According to SkingRewards, there was a net decrease of 5.2,000 ETH worth of Ethereum staked in the past 30 days. A significant decrease in the amount of Ethereum staked is a bearish sign as it means investors are selling their tokens.