


Ethereum has been trending lower for over four weeks and appears to be forming a bearish rounded top, suggesting there may be a risk of further losses in the coming weeks.
summary
- Ethereum price is down 41% from its year-to-date high.
- ETH price remains under pressure due to bearish macro catalysts leading to weak demand.
- A pattern of rounding upside over multiple months could expose prices to more risk.
Ethereum (ETH) has been in a near-free fall since October 28, dropping 29% year-to-date and dropping to 41%, according to data from crypto.news. The leading altcoin in the cryptocurrency industry, trading at $2,926 at the time of writing, has seen a slight rebound, rising 2% over the past day.
Ethereum prices fell amid a broader market correction that saw Bitcoin (BTC) fall well below the $100,000 support level amid macroeconomic concerns, including US Federal Reserve Chairman Jerome Powell’s hawkish comments on further interest rate cuts. This scared traders and led to a flight from risky assets.
The Fear and Greed Index, which traders use to gauge market sentiment, reached “extreme fear” levels by mid-November. This widespread fear triggered a wave of liquidations, creating further selling pressure across major cryptocurrencies, including Ethereum.
You may also like: Cryptocurrency price today (November 25th): BTC is 90,000, focus on ETH, XRP, SOL, recovery as the probability of interest rate cuts increases due to the Fed’s dovish direction
The second-largest crypto asset by market capitalization also fell as demand for spot ETFs waned. Nine U.S. Spot Ether ETFs have seen net outflows of more than $2.1 billion since mid-October, according to data from SoSoValue.
While some companies like BitMine are ramping up their Ethereum accumulation with large purchases, broad investor sentiment appears to remain weak. Momentum remains fragile and if selling pressure continues, Ethereum is very likely to slide further into the lower support zone.
On the daily chart, Ethereum’s price downtrend that began in early October has formed a multi-month rounded pattern of upside, which typically tends to portend long-term bearish momentum.
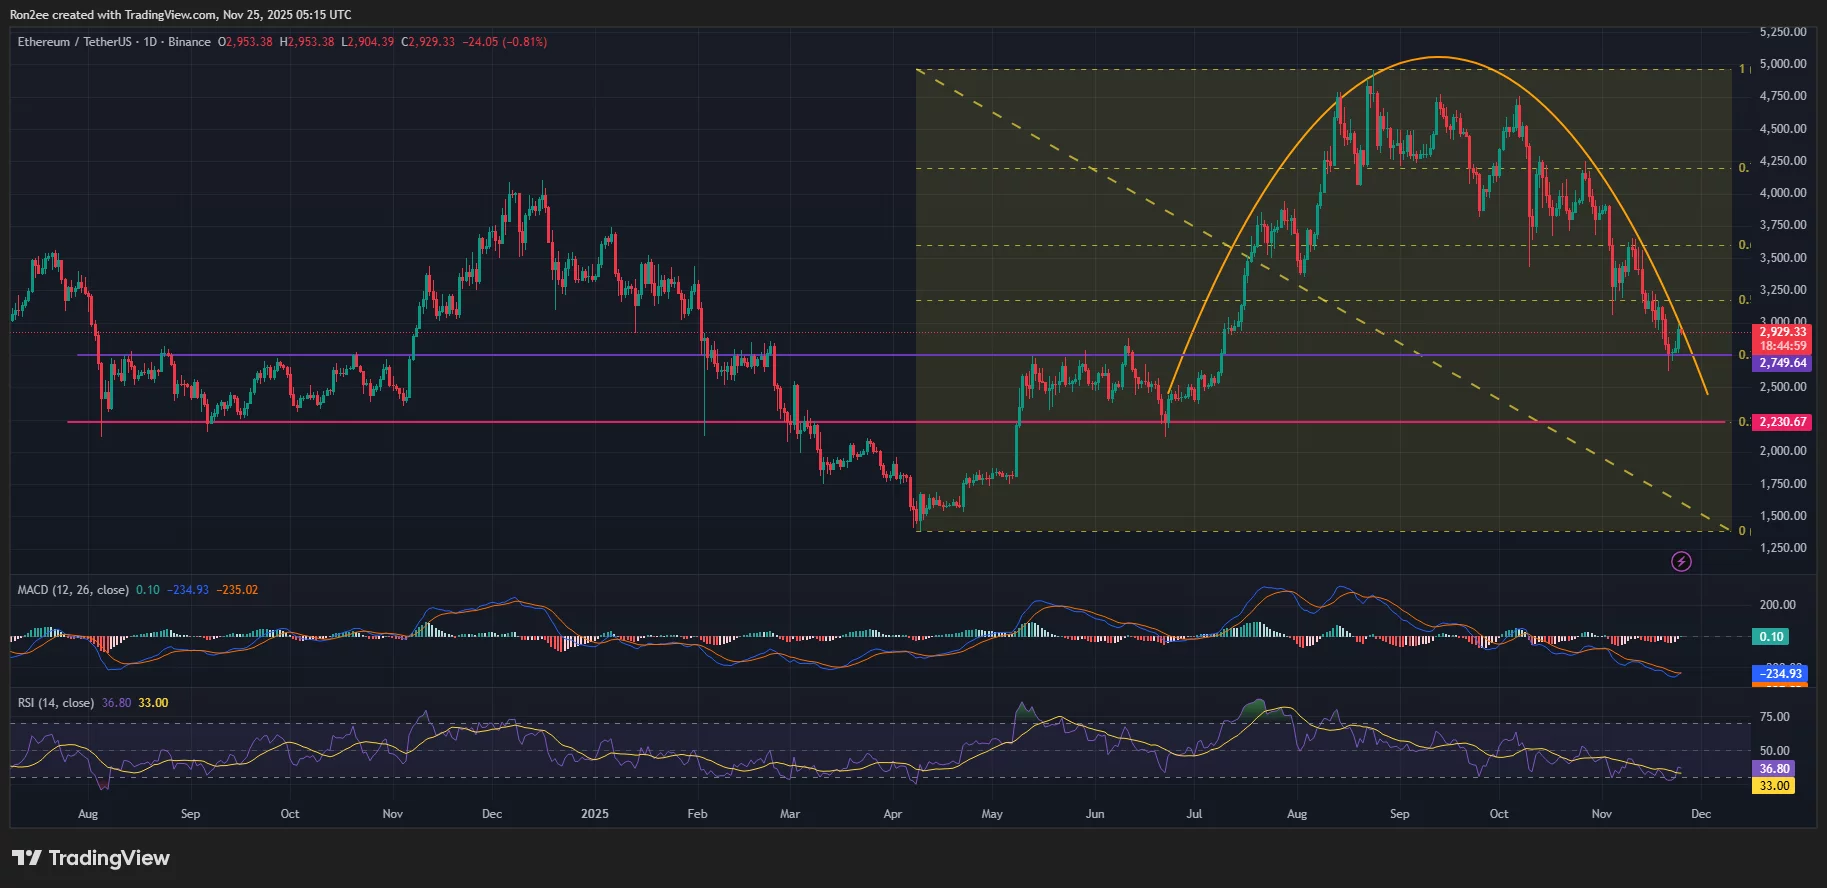
Ethereum price forms bearish pattern on daily chart — November 25 | Source: crypto.news
For example, Solana (SOL) experienced a nearly 49.9% plunge as it formed such a pattern on the chart, falling from a September high of $247.56 to a low of $124.
At the time of writing, the altcoin’s price was testing a breakout from a rounded top pattern after turning into support the $2,750 level, which has served as a major resistance many times since 2024.
What should be of concern to investors, however, is that even if Ethereum price is able to break out of the pattern, the resulting spin-off could lead to the formation of a handle. This could eventually lead to a cup-and-handle reverse setup, which is considered a more serious bearish continuation structure that could scare short-term traders.
For now, traders should focus on $2,230, which is the next important support level to watch. This level has acted as a strong demand zone in the past, providing a solid foundation during multiple correction stages and rebounding early in the cycle. At the time of writing, this support level is approximately 24% below the current price.
read more: Strategy raises $21 billion since the beginning of the year with new funding structure
Disclosure: This article does not represent investment advice. The content and materials published on this page are for educational purposes only.