

The cryptocurrency market is facing a wave of volatility. Ethereum ($Ethereum)The world’s second-largest digital asset has plummeted below psychologically important levels. $3,000 The move comes after weeks of price action and failed attempts to break out of the $3,400 resistance level.
Ethereum Price Analysis: $3,200 Breakdown
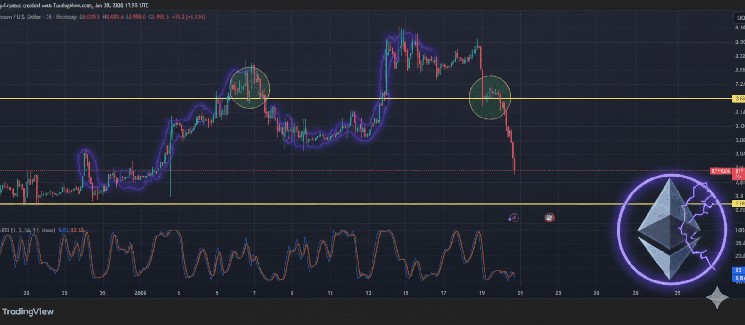
Looking at the 2 hour chart, Ethereum-USD, bearish momentum strengthened after price failed to sustain yellow support line $3,200.
The chart highlights two important areas (circled in yellow) where price interacts with this horizontal level. Initially, $3,200 acted as a local peak and subsequent support. However, in the recent breakdown, a large number of red candlesticks sharply sliced through this floor, accelerating the decline towards the current trading price. $2,992.
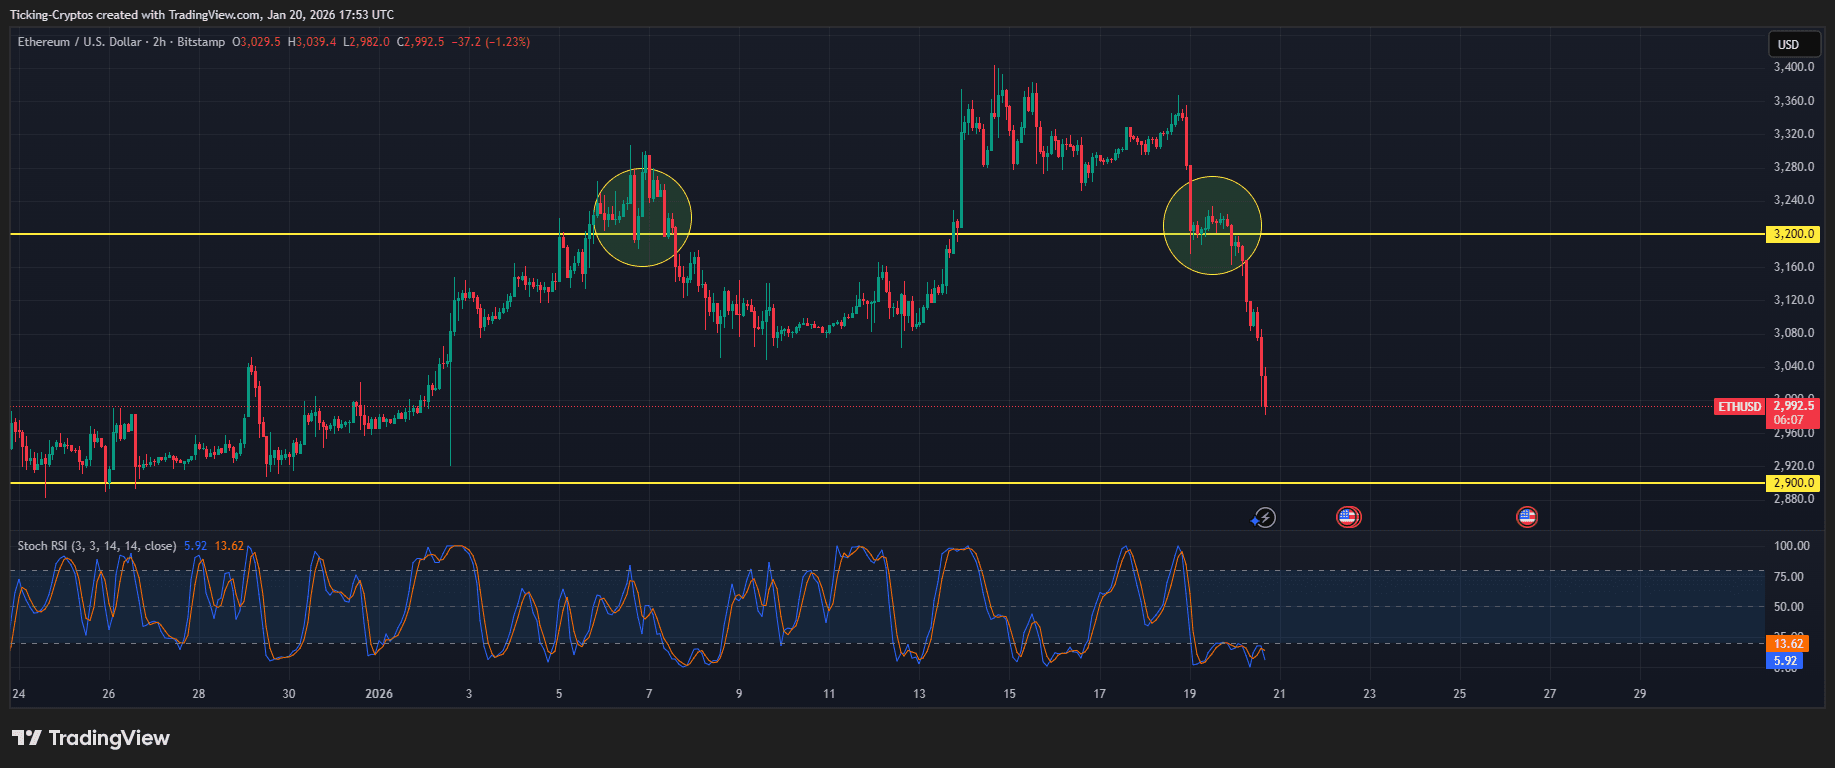
Ethereum/USD 2H – TradingView
- Resistance turns to support: The $3,200 level has now reversed into a formidable resistance zone.
- Support floor for: For the time being, horizontal support can be found at: $2,900 (Indicated by the yellow line below). if Ethereum Failure to stabilize here opens the door to a deeper correction towards the $2,700 demand zone.
- Stochastic RSI: The indicator at the bottom of the chart shows approximately the following values: 5.92placing Ethereum deep oversold region. This often precedes a “dead cat bounce,” but the current steepness of the decline suggests that sellers are in control for now.
Why is Ethereum falling today?
The broader cryptocurrency market is currently in a “risk-off” environment. Geopolitical tensions and changes in macroeconomic trade policy are causing investors to shift money away from higher-risk assets such as Bitcoin (BTC$) and Ethereum and into traditional safe-haven assets such as gold, Bloomberg reports.
Furthermore, the liquidation of leveraged long positions further exacerbated this movement. when Ethereum A drop below $3,100 triggered a chain of stop losses, providing “liquidity” against the sharp vertical decline seen on the chart.
How to trade Ethereum: Strategies for traders
For those looking to navigate this volatility, monitoring daily closing prices is essential. If $3,000 is not recovered soon, a medium-term bearish trend could be confirmed. Investors should consider using exchange comparison to compare current market conditions and fees to ensure they are using the most liquid platform during times of high volatility.
Additionally, it is important for long-term holders to ensure that their assets remain off-exchange. Check out our latest hardware wallet comparison to find the best security solution.
The focus remains on the $2,900 support level as the market searches for a bottom. A breakdown here could signal a retest of the 2025 lows.