


Ethereum is trying to regain the $3,000 level while the entire crypto market remains trapped in a phase of uncertainty and uneven confidence. Price action suggests that buyers are prepared to defend key support zones, but momentum remains fragile and the rally struggles to extend meaningfully. This hesitation comes against a backdrop of rising leverage and volatile derivatives activity, which continues to shape near-term market trends.
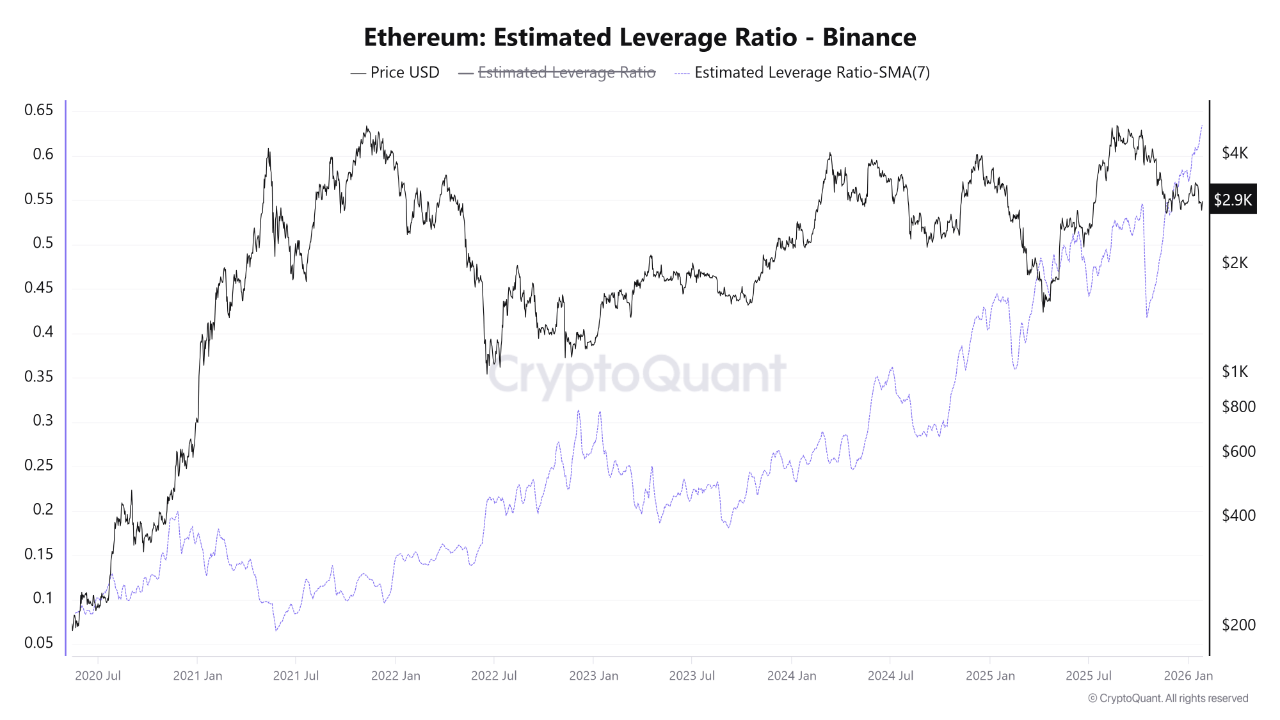
A recent report from CryptoQuant highlights a growing source of risk behind the scenes. Ethereum’s estimated leverage ratio on Binance remains at an all-time high, with the 7-day simple moving average hovering around 0.632.
This indicates a concentration of leveraged positions, making the market increasingly sensitive to sudden price movements and liquidation events. At the same time, order flow data shows volatile behavior by traders, reinforcing the view that the current structure lacks balance.
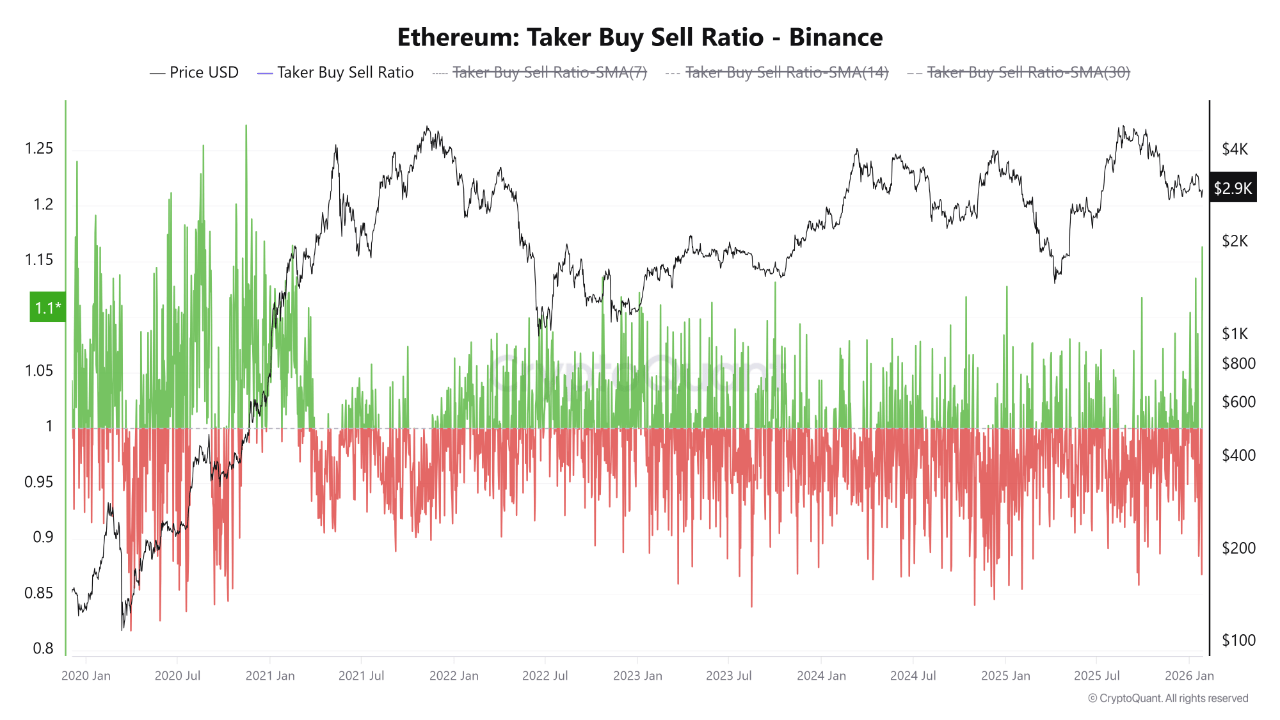
The taker-by-sell ratio clearly shows this instability. On January 25th, the indicator fell to 0.86, its lowest level since September, indicating that selling was in the ascendant. Immediately after that, it rebounded sharply to 1.16, the highest daily level since February 2021, reflecting the market’s aggressive buying. Such sudden reversals highlight market weakness Driven by short-term positioning rather than confidence in lasting direction.
High leverage increases volatility risk and Ethereum consolidates
The report explains that this sudden change in taker behavior is unfolding while Ethereum price trends remain structurally weak. After failing to break through the all-time high of $4,800, $ETH The price has entered an extended correction phase and is currently consolidating around the $2,800 support zone.
This level has been a short-term pivot and has repeatedly absorbed selling pressure, but has failed to generate sustained upward momentum. The lack of follow-through highlights how the market is caught between defensive buyers and aggressive short-term traders.
This phase is particularly sensitive to the interaction between price compression and increased leverage. Ethereum’s estimated leverage ratio remains near all-time highs, so even modest price movements can trigger a large reaction in the derivatives market.
A rapid reversal in the taker-by-sell ratio reinforces this vulnerability, indicating that the positioning is rapidly reversing rather than building in a stable direction. This situation is often preceded by a sharp increase in volatility rather than an orderly trend.
In this setup, Ethereum appears to rely heavily on clear external or internal catalysts. In the absence of decisive changes in macro conditions, spot demand, or network-specific developments, price trends are likely to remain reactive. Until either side is found guilty, the combination of high leverage and volatile order flow increases the risk of sudden liquidations and increases the likelihood of sudden and chaotic price movements around key technical levels.
Price Action Details: Testing Critical Resistance
Ethereum’s price movement reflects a situation caught between market stabilization and unresolved downside risks. On the daily chart, $ETH It is trading near $3,000 after several failed attempts to regain higher levels, highlighting this zone as an important psychological and technical pivot.
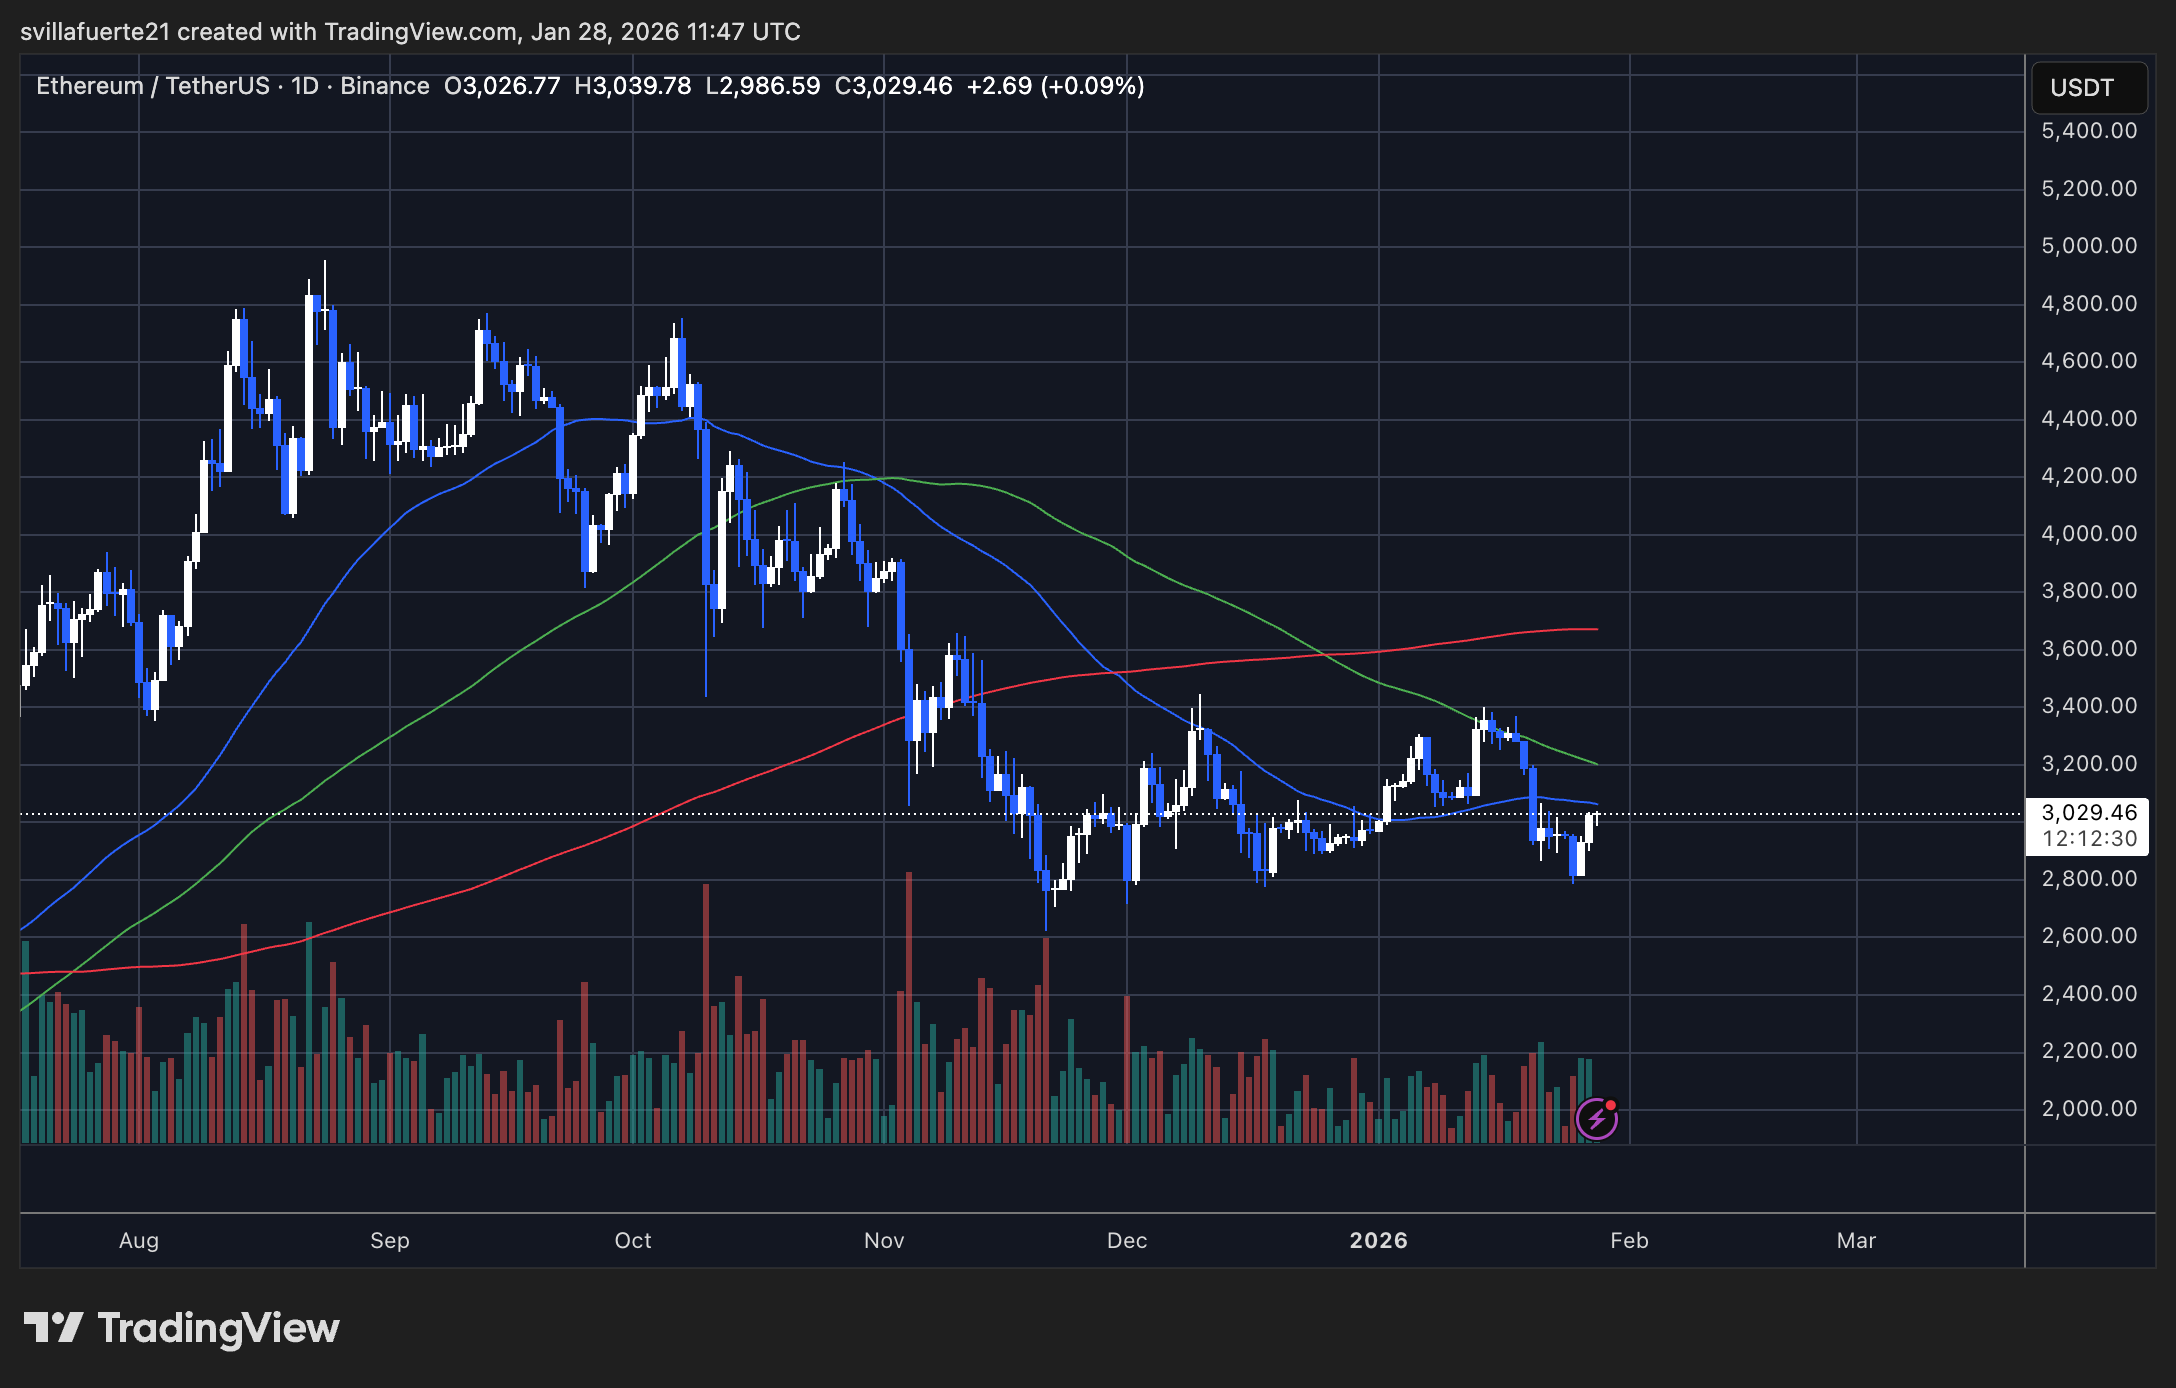
Price remains below the 50-day moving average and the 100-day moving average, both of which are trending down, supporting the idea that short-to-medium term momentum is still fragile. The 200-day moving average is sitting higher near the mid-$3,500s, serving as a clear indicator of deterioration in the broader trend beyond the 200-day period. $ETH Could not exceed $4,000.
$ETH A strong impulsive uptrend has given way to a broad consolidation between approximately $2,800 and $3,400. The recent bounce from the lower end of this range suggests that buyers are still defending the $2,800 support zone, but volume remains modest compared to the previous decline, indicating a lack of strong conviction on either side. So far, each upward attempt has produced lower highs, consistent with a correction or distribution phase rather than a new trend.
only for $ETH If sustained above $2,800, the market could argue for consolidation and foundation building. However, a sustained break below that level will expose the downside towards the $2,500-$2,600 region. Conversely, a meaningful improvement in the technical outlook would require a return to the $3,300-$3,400 region.
Featured image from ChatGPT, chart from TradingView.com