

Ethereum network activity has surged to record highs across multiple metrics, but that growth has neither increased Ethereum’s price nor increased fee generation at the base layer.
Daily active addresses on Ethereum approached 2 million in February 2026, surpassing the peak seen during the 2021 bull market, according to a weekly report published by analytics firm CryptoQuant on March 10. An active address is a unique blockchain wallet address that has sent and received transactions within a specific time period, such as the past 24 hours.
Smart contract invocations, or code that tells the blockchain to do something specific, were made over 40 million times a day, and token transfers due to internal contract exchanges also set records. The findings show that despite weakening investment demand for Ethereum, it is widely adopted across DeFi, stablecoins, and automated protocol activities.
Records of network user activity are usually a good indication of the market value of a blockchain’s native token. However, this is not the case with Ethereum.
The native token Ethereum has fallen about 30% in the past six months, and the one-year change in Ethereum’s realized market capitalization has turned negative, indicating a net capital outflow from the market.
Exchange flow data from CryptoQuant shows that Ether is moving into trading venues at a faster rate compared to Bitcoin, a pattern consistent with increasing selling pressure.
focus on capital flows
CryptoQuant argued that capital flows, rather than network activity, now more effectively explain ETH price movements.
Previous cycles, especially 2018 and 2021, have seen an increase in on-chain activity and price increases. That relationship has weakened. The company’s scatter analysis shows that recent observations are concentrated where activity levels are high but prices are relatively low, suggesting that increased usage has less power to explain Ether’s valuation.
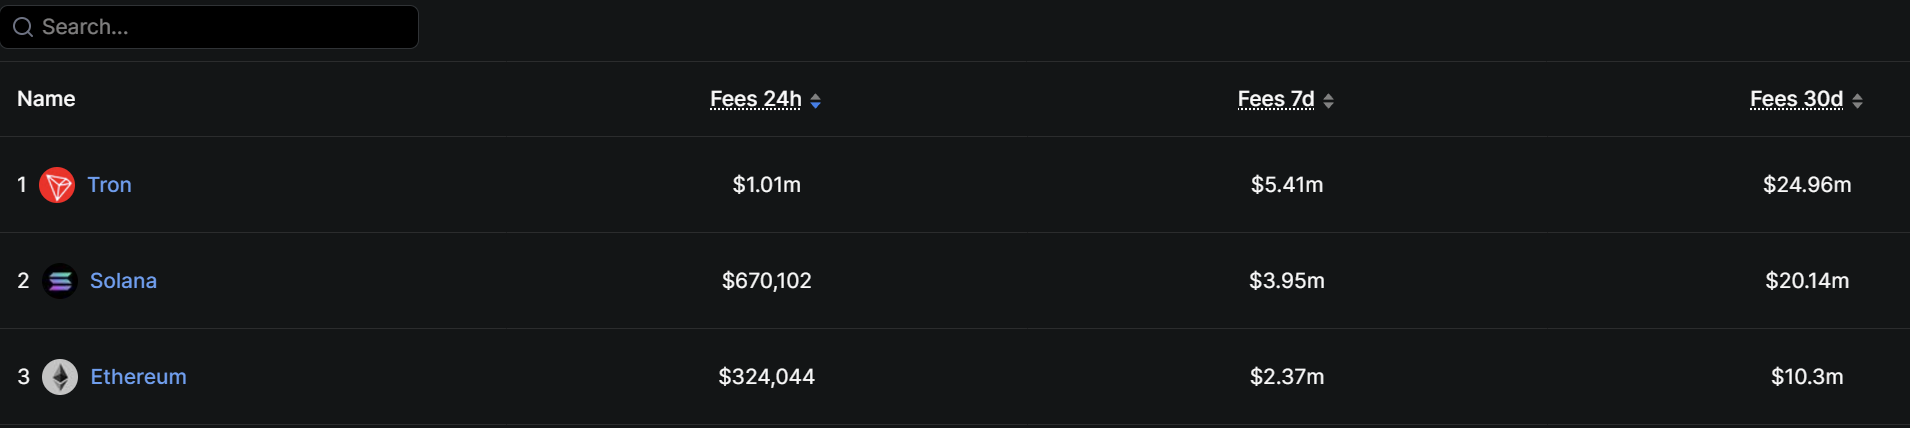
The painting of charges emphasizes the disconnection. According to data from DefiLlama, Ethereum has generated about $10.3 million in transaction fees in the past 30 days, ranking third behind Tron with about $25 million and Solana with about $20 million.
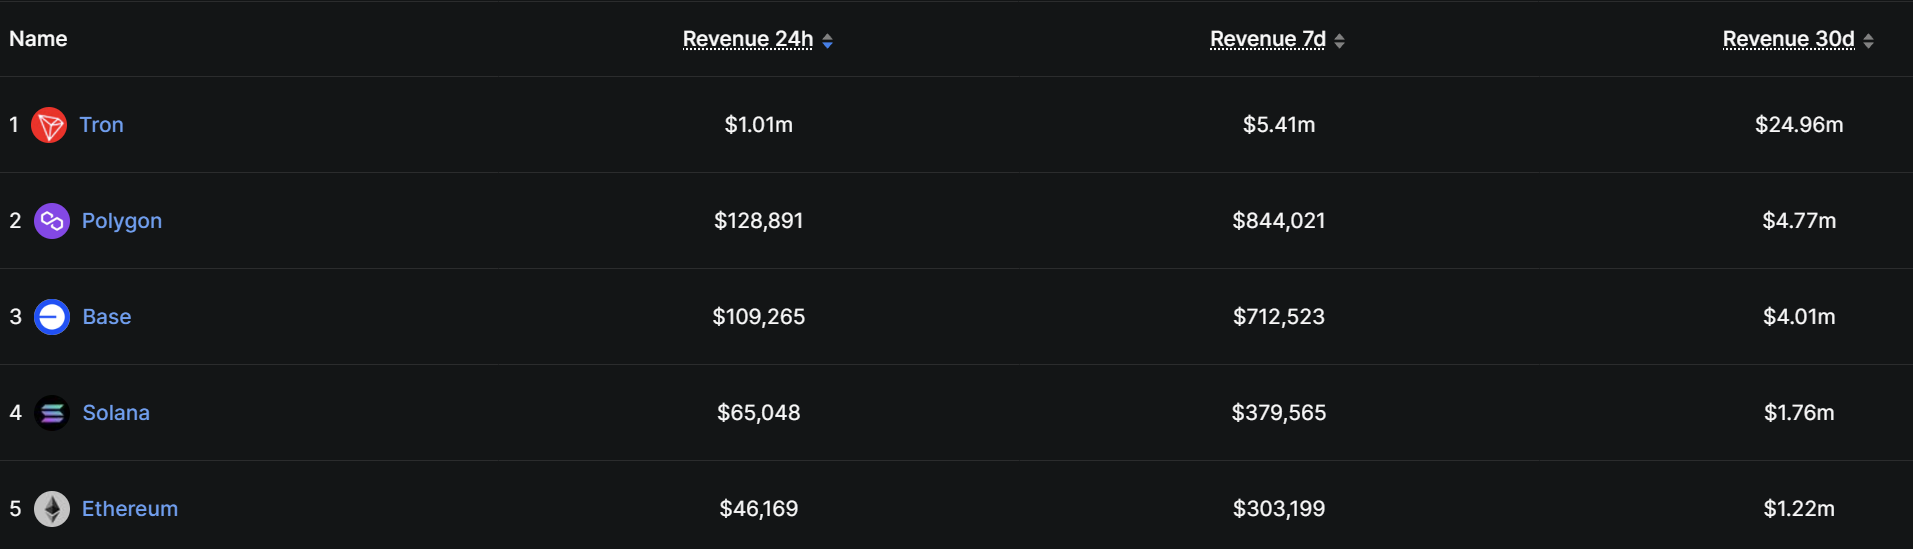
On a revenue basis, the difference is even wider. Ethereum ranked fifth in 30-day protocol revenue with $1.22 million, trailing Tron, Polygon, Base, and Solana. Base, Ethereum’s Layer 2 network built by Coinbase, generated nearly three times the protocol revenue of Ethereum over the same period.
This difference reflects the growing role of Ethereum’s Layer 2 ecosystem. Networks like Base and Polygon process large volumes of transactions while paying relatively small settlement costs to the base chain, distributing economic activity across the broader Ethereum ecosystem rather than concentrating it in the base layer.
Stablecoins remain a bright spot for adoption. According to DefiLlama, Ethereum hosts a stablecoin supply of approximately $162 billion, representing approximately 52% of the global market. However, its activities have not led to the acquisition of a proportionate value of the ether itself.
Ethereum may be busier than ever, but the value that the blockchain’s native assets create on it is decreasing.