


Ethereum is showing strong chart structure as some market analysts suggest the price could rise to $7,000 by mid-2026.
Meanwhile, assets have maintained key levels after the recent decline, and trading activity reflects a phase of correction. Analysts cited long-term patterns and investor behavior as reasons for this expectation.
Weekly chart forms bullish pattern
A technical chart shared by analyst Mike Investing shows Ethereum trading within a flag formation on the weekly time frame. This setup followed a steady price increase from late 2024 to early 2025. After climbing above $4,400, ETH has corrected slightly and is currently trading around $4,100.
$ETH is sitting within an aggressive bullish flag and a euphoric squeeze is just around the corner.
This opportunity is generational, as ETH bottomed out this year, completing its last tough drop below $4,000.
Bears are now in great danger.
$7,000 by May 2026.
Please mark my words… pic.twitter.com/EDBIFtdY2R
— Mike Investing (@MrMikeInvesting) October 14, 2025
According to the chart, this pullback is still within the bullish structure. The 200-week moving average, currently near $2,447, continues to act as support. ETH is trading above this level, maintaining its long-term trend. The analyst expects it to rise to $7,000 by May 2026. A break below the $3,500-$3,600 zone would put the current setup at risk, it added.
Furthermore, analyst Michael van de Poppe pointed out the formation of lows in recent price trends. In a post about X, he said:
“A low is forming here in $ETH. I think we will see a strong breakout and new ATH over the next week or two.”
His chart shows ETH rebounding from the $3,600 to $3,900 zone that has held as support during past tests. As of the latest update, ETH was trading around $4,100 after falling from $4,600. Trading volumes are starting to increase again, which may indicate new demand.
You may also like:
- How the US-China conflict has shaken up Ethereum: falling prices and cooling derivatives market
- Crypto market shows pain and potential after massive liquidation event: Bitfinex Alpha
- BitMine buys DIP, Ethereum stash exceeds 3 million ETH
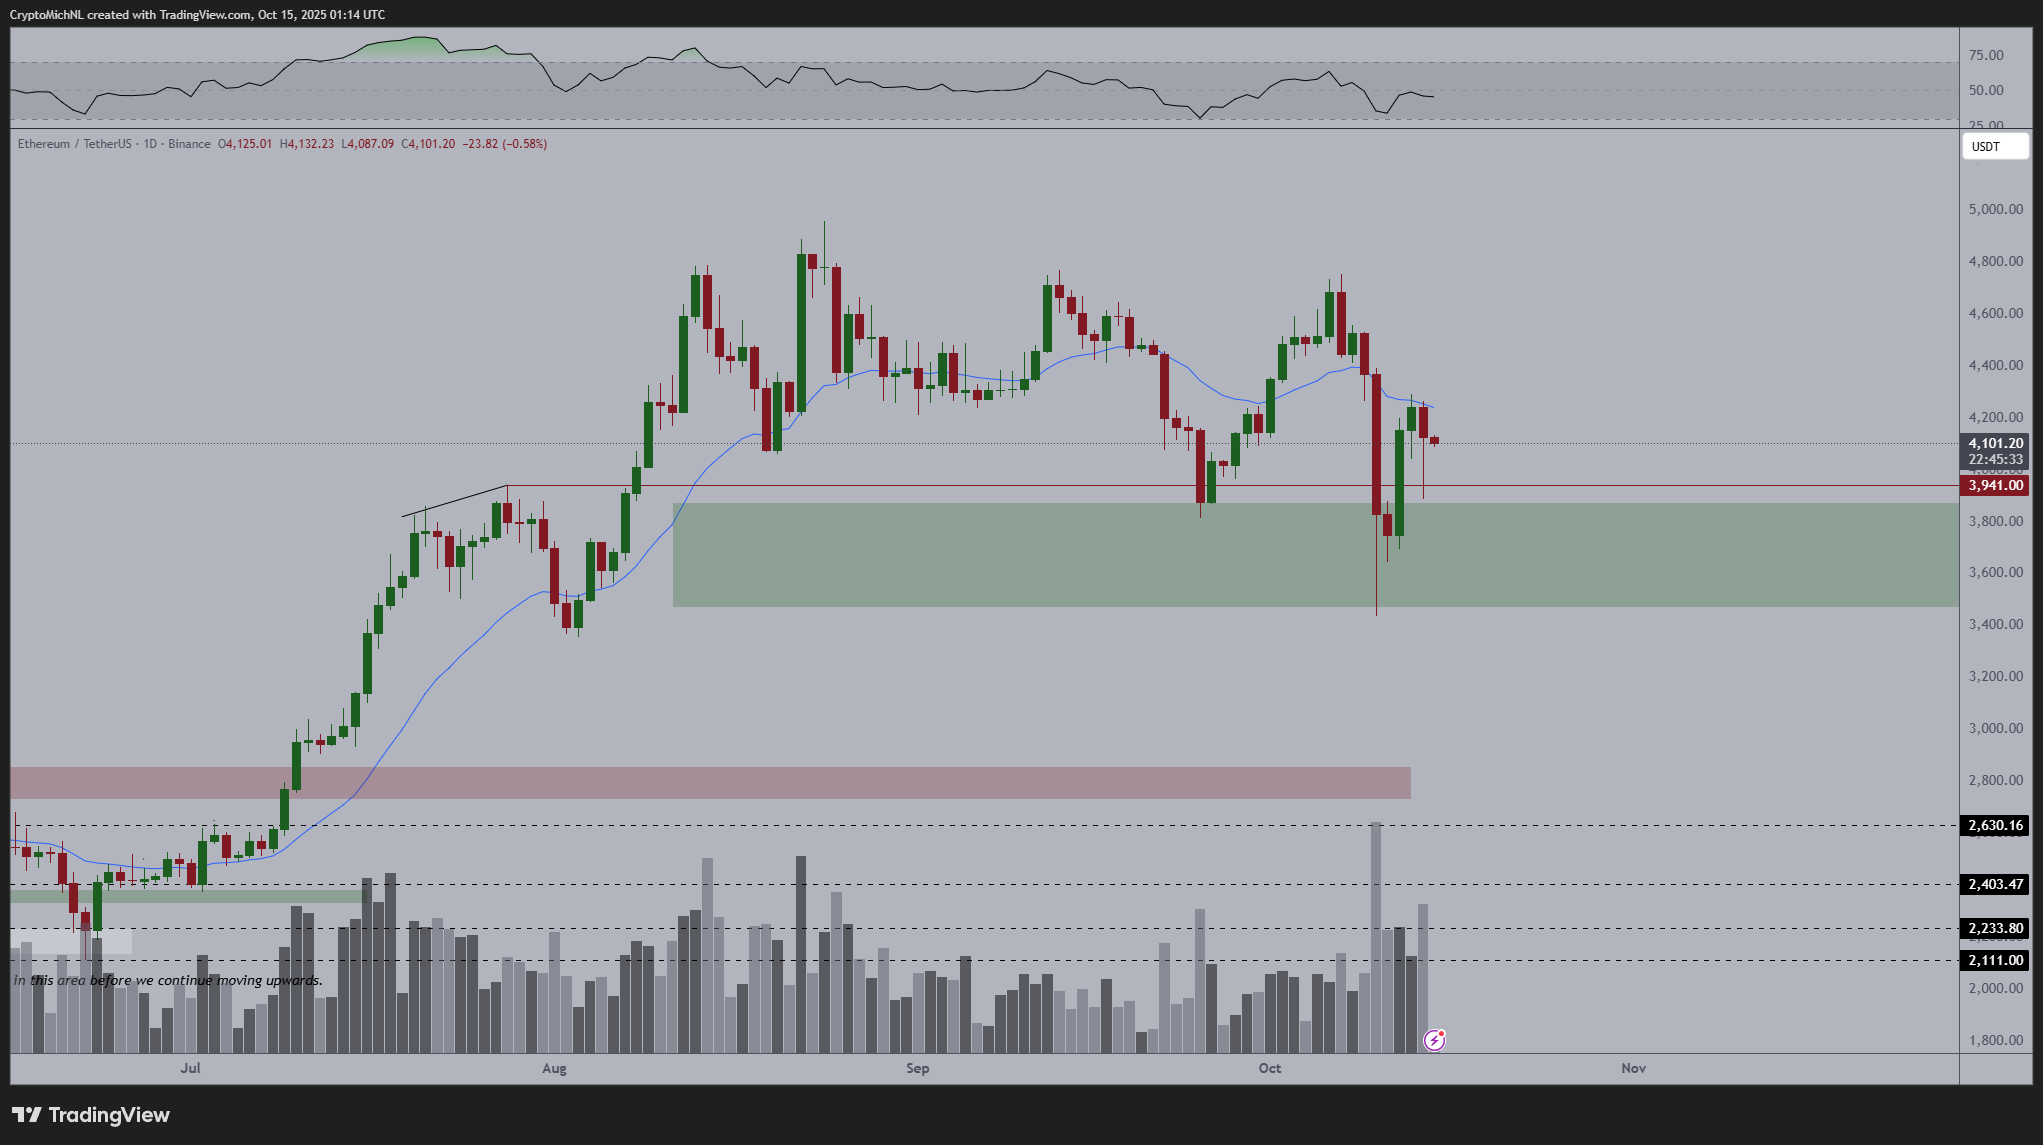
The 21-day EMA is currently flat. If the asset closes above that, it could retest recent highs. RSI levels remain in the moderate range with room for further movement in either direction. The current pattern supports the idea of stable accumulation as long as price remains above support.
Foreign exchange balances hit multi-month lows
Ethereum supply on Binance has reached its lowest level in months, according to data from CryptoQuant analyst Arab Chain. The current supply ratio is approximately 0.33. This suggests that more ETH is moving from exchanges to self-custodial wallets.
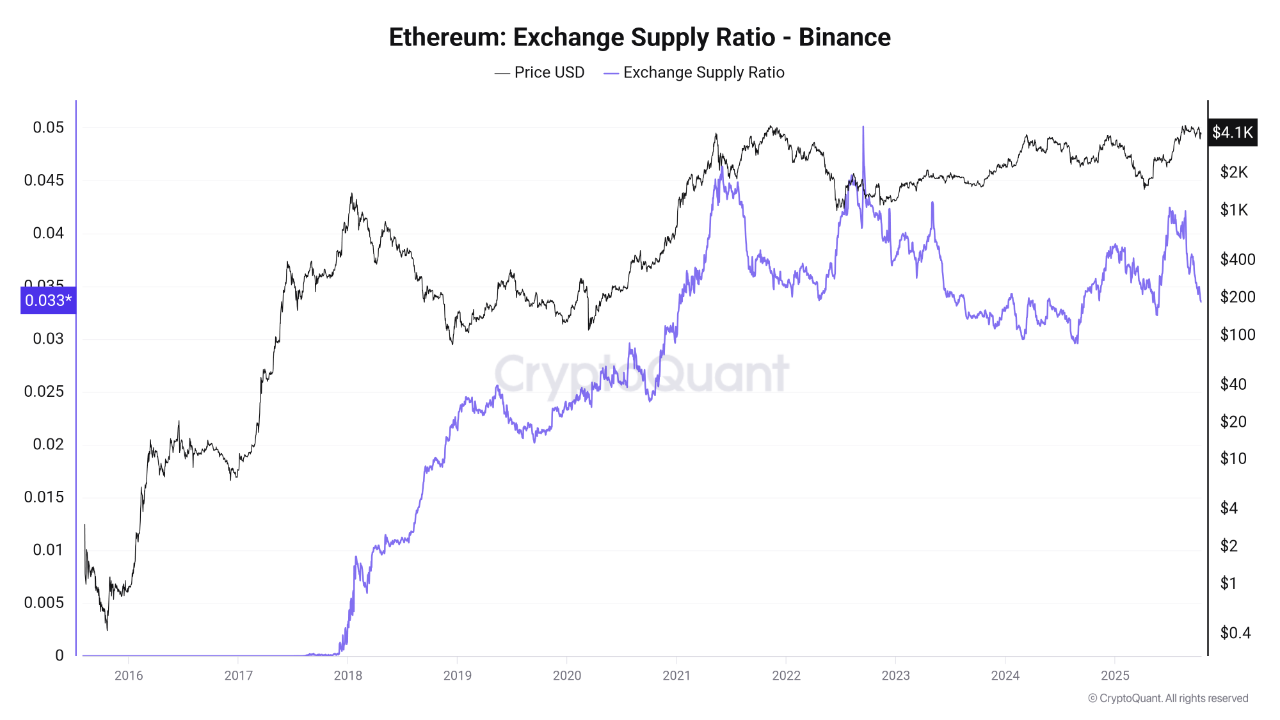
Such movements often indicate a decline in short-term selling activity. In previous market cycles, similar trends were followed by price increases. Investors appear to be taking a long-term view and are removing coins from exchanges, reducing the supply available on the open market.
Whale activity increases as retail industry retreats
$ETH is decreasing in retail.
Whales are loading.
I’m chasing smart money! pic.twitter.com/iiLb55BXj8
— CryptoGoos (@crypto_goos) October 15, 2025
This post reflects the growing behavioral differences between small and large investors. This is supported by recent data. While retail trading volume is decreasing, there is a parallel increase in ETH accumulation by large wallet holders.
Along with this, institutional interest in self-storage and staking continues to grow. Concentrated platforms are holding fewer coins, which contributes to lower market liquidity and indicates a long-term holding strategy.