


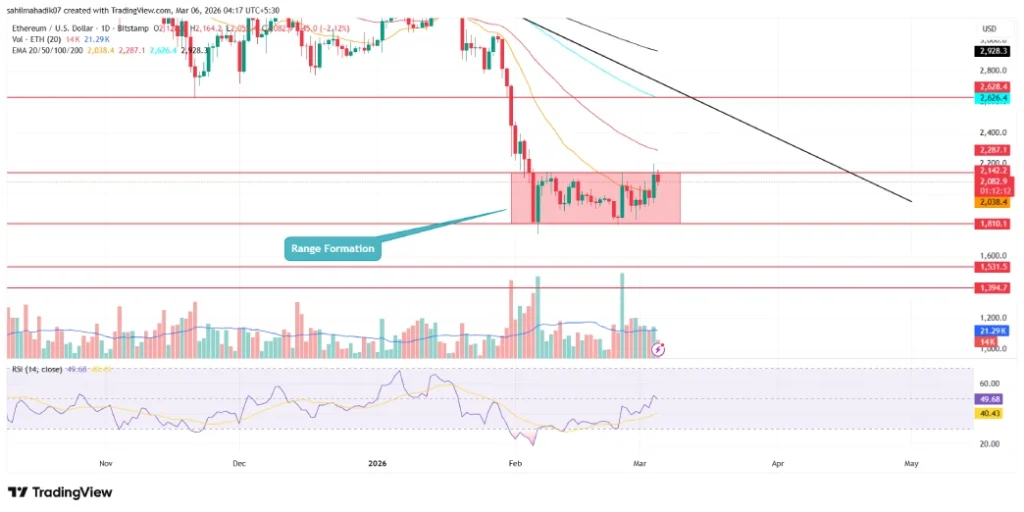
- Ethereum faces a 12% downside risk as sellers continue to defend the $2,142 resistance.
- A breakout from the narrow range between $2,142 and $1,800 could determine the next dynamic move. $ETH.
- The average number of new Ethereum address creations is 284,800, indicating strong expansion of the network.
On March 5th, Ethereum price fell by 1.5% and the current trading price reached $2,096. The decline follows in the footsteps of Bitcoin as the recovery takes a breather after rallying earlier in the week. meanwhile $ETHAlthough its price trend does not give clear confidence of a sustainable recovery, its network activity indicates strong growth potential in fundamentals, reinforcing its long-term growth potential.
$ETH Faces pressure on $2,000 floor as on-chain activity reaches multi-year highs
On Thursday, the crypto market witnessed a slowdown in its recovery, with its market capitalization declining by about 2% to $2.43 trillion. The decline coincides with Bitcoin’s reversal from the $74,000 level as tensions between the U.S. and Iran flare up, oil prices soar in the broader market, and risk assets come under pressure.
Following this momentum, Ethereum price has returned from $2,142, but network activity continues to show strong growth into early March 2026. In a recent tweet, on-chain analytics platform Santiment highlighted that the 30-day average of daily active addresses reached 837,200. This figure represents an 82% increase from levels five years ago and a massive 1,135% increase over the past 10 years alone.
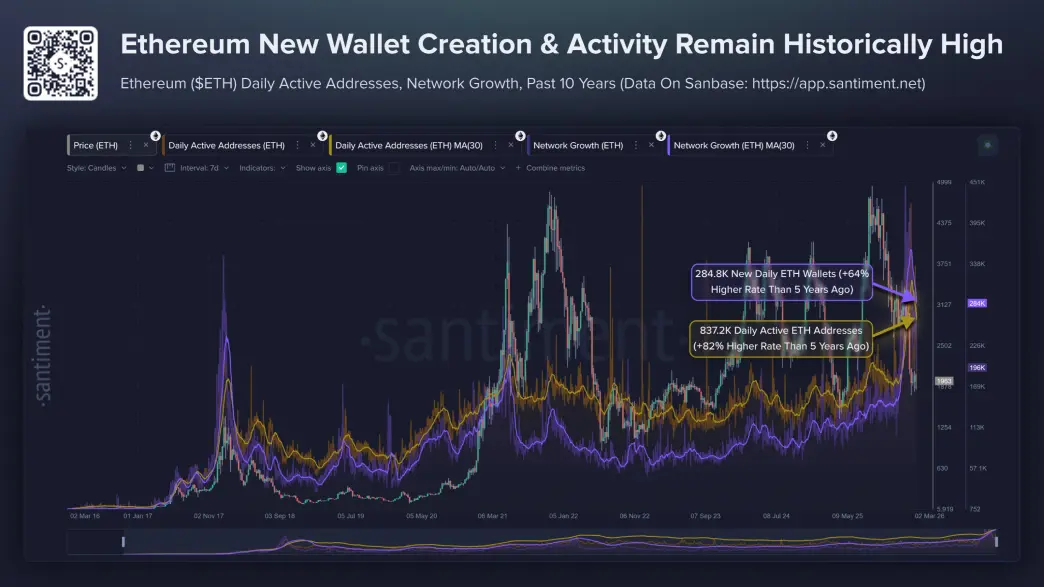
New address creations reported a similar trend at 284,800 on a similar rolling basis. This is a 64% increase compared to five years ago and a 1,967% increase compared to 10 years ago. These numbers demonstrate the continued onboarding and engagement of new users on the blockchain.
meanwhile, $ETH Continued trading pressure from both sides of the market has seen short-term moves towards or near the $2,000 mark. The combination of high activity indicators and price consolidation indicates that the underlying adoption trend continues despite short-term valuation fluctuations.
Ethereum price fluctuates in a narrow range before next breakout
Today’s market pullback has seen Ethereum price show a bearish reversal from the $2,142 resistance and is currently trading at $2,088. This reversal indicates that indirect supply is intact and market participants maintain selling sentiment, pointing to the risk of further correction.
Over the past month, Ethereum price has stabilized within two horizontal levels: $2,142 and $1,800. Following a correction in early February, the ongoing sideways movement aims to regain bearish momentum and strengthen the upcoming breakdown.
The downward trend of the EMAs on the daily chart at 50, 100, and 200 highlighted that the path to least resistance is down, with the overall market trending downward. If selling pressure continues, $ETH The price is likely to fall by around 12% and break through the $1,800 support.
A post-break decline could push this correction to the next key support at $1,530.
$ETH/USDT -1 day chart
Conversely, if buyers convert the $2,142 resistance into potential support, the coin price could rise by 14% to challenge the $2,450 downtrend line. Daily chart analysis highlights this downtrend line as a key resistance level that is driving the current correction.
Also read: Opinion ($OPN) expands market presence after listing on major exchanges