


ETH price is testing a key support level after forming a bullish reversal pattern. Could a rebound from here put it back on track for a strong rally?
summary
- ETH price is testing the $4,100 support level after falling from Monday’s high.
- A double bottom pattern has formed on the 4-hour chart.
- Technical indicators are showing early signs of a reversal.
On Monday, Ethereum (ETH) rose 10% to a weekly high of $4,232 before falling back as profit taking began to roll in, moving closer to $4,100, the psychological support it needs to maintain to prevent further losses.
Ethereum’s decline follows the formation of a double bottom pattern on the 4-hour chart, which often leads to a reversal to an uptrend. In the case of Ethereum, both lows of the pattern formed around the $3,713 level, with the neckline just around $4,100, currently acting as a key resistance zone.
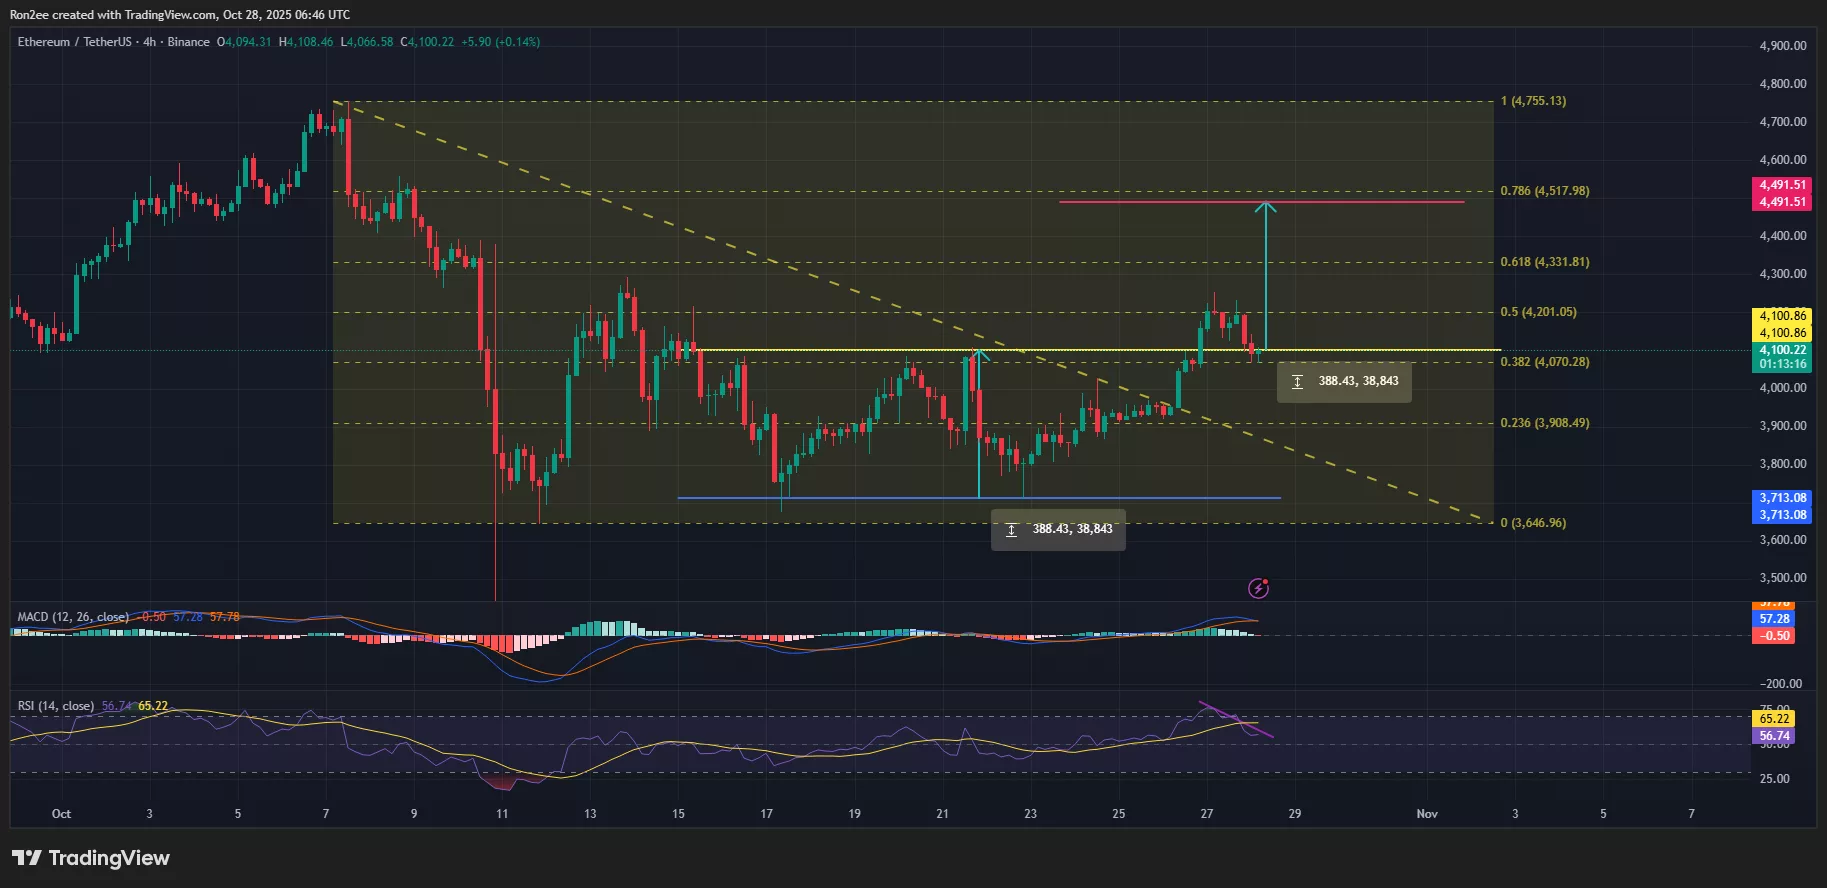
ETH price forms a bullish reversal pattern on 4-hour chart — October 28 | Source: crypto.news
A breakout from this type of structure can lead to a sustained trend reversal over several days. In Ethereum’s case, a confirmed move above the neckline would open the door for a rally towards $4,491, a 10% increase from current levels. The target is calculated by adding the depth of the double bottom formed to the breakout point.
You may also like: 402bridge hack led to over 200 users losing USDC
However, some caution should be exercised with momentum indicators that send mixed signals. The MACD line appears to be approaching a bearish crossover with the signal line, while the RSI is forming a bearish divergence. Both are signs that the rally may weaken in the short term.
For now, $4,100 is acting as an immediate resistance zone, but downside support lies around $4,000, a psychological level that Ethereum needs to maintain if it wants to continue its upward trajectory.
According to CoinGlass’ 24-hour liquidations heatmap, there is a notable cluster of short-term liquidations between $4,100 and $4,200, coinciding with the neckline of the double bottom pattern and the upper bound of the previously identified descending wedge.
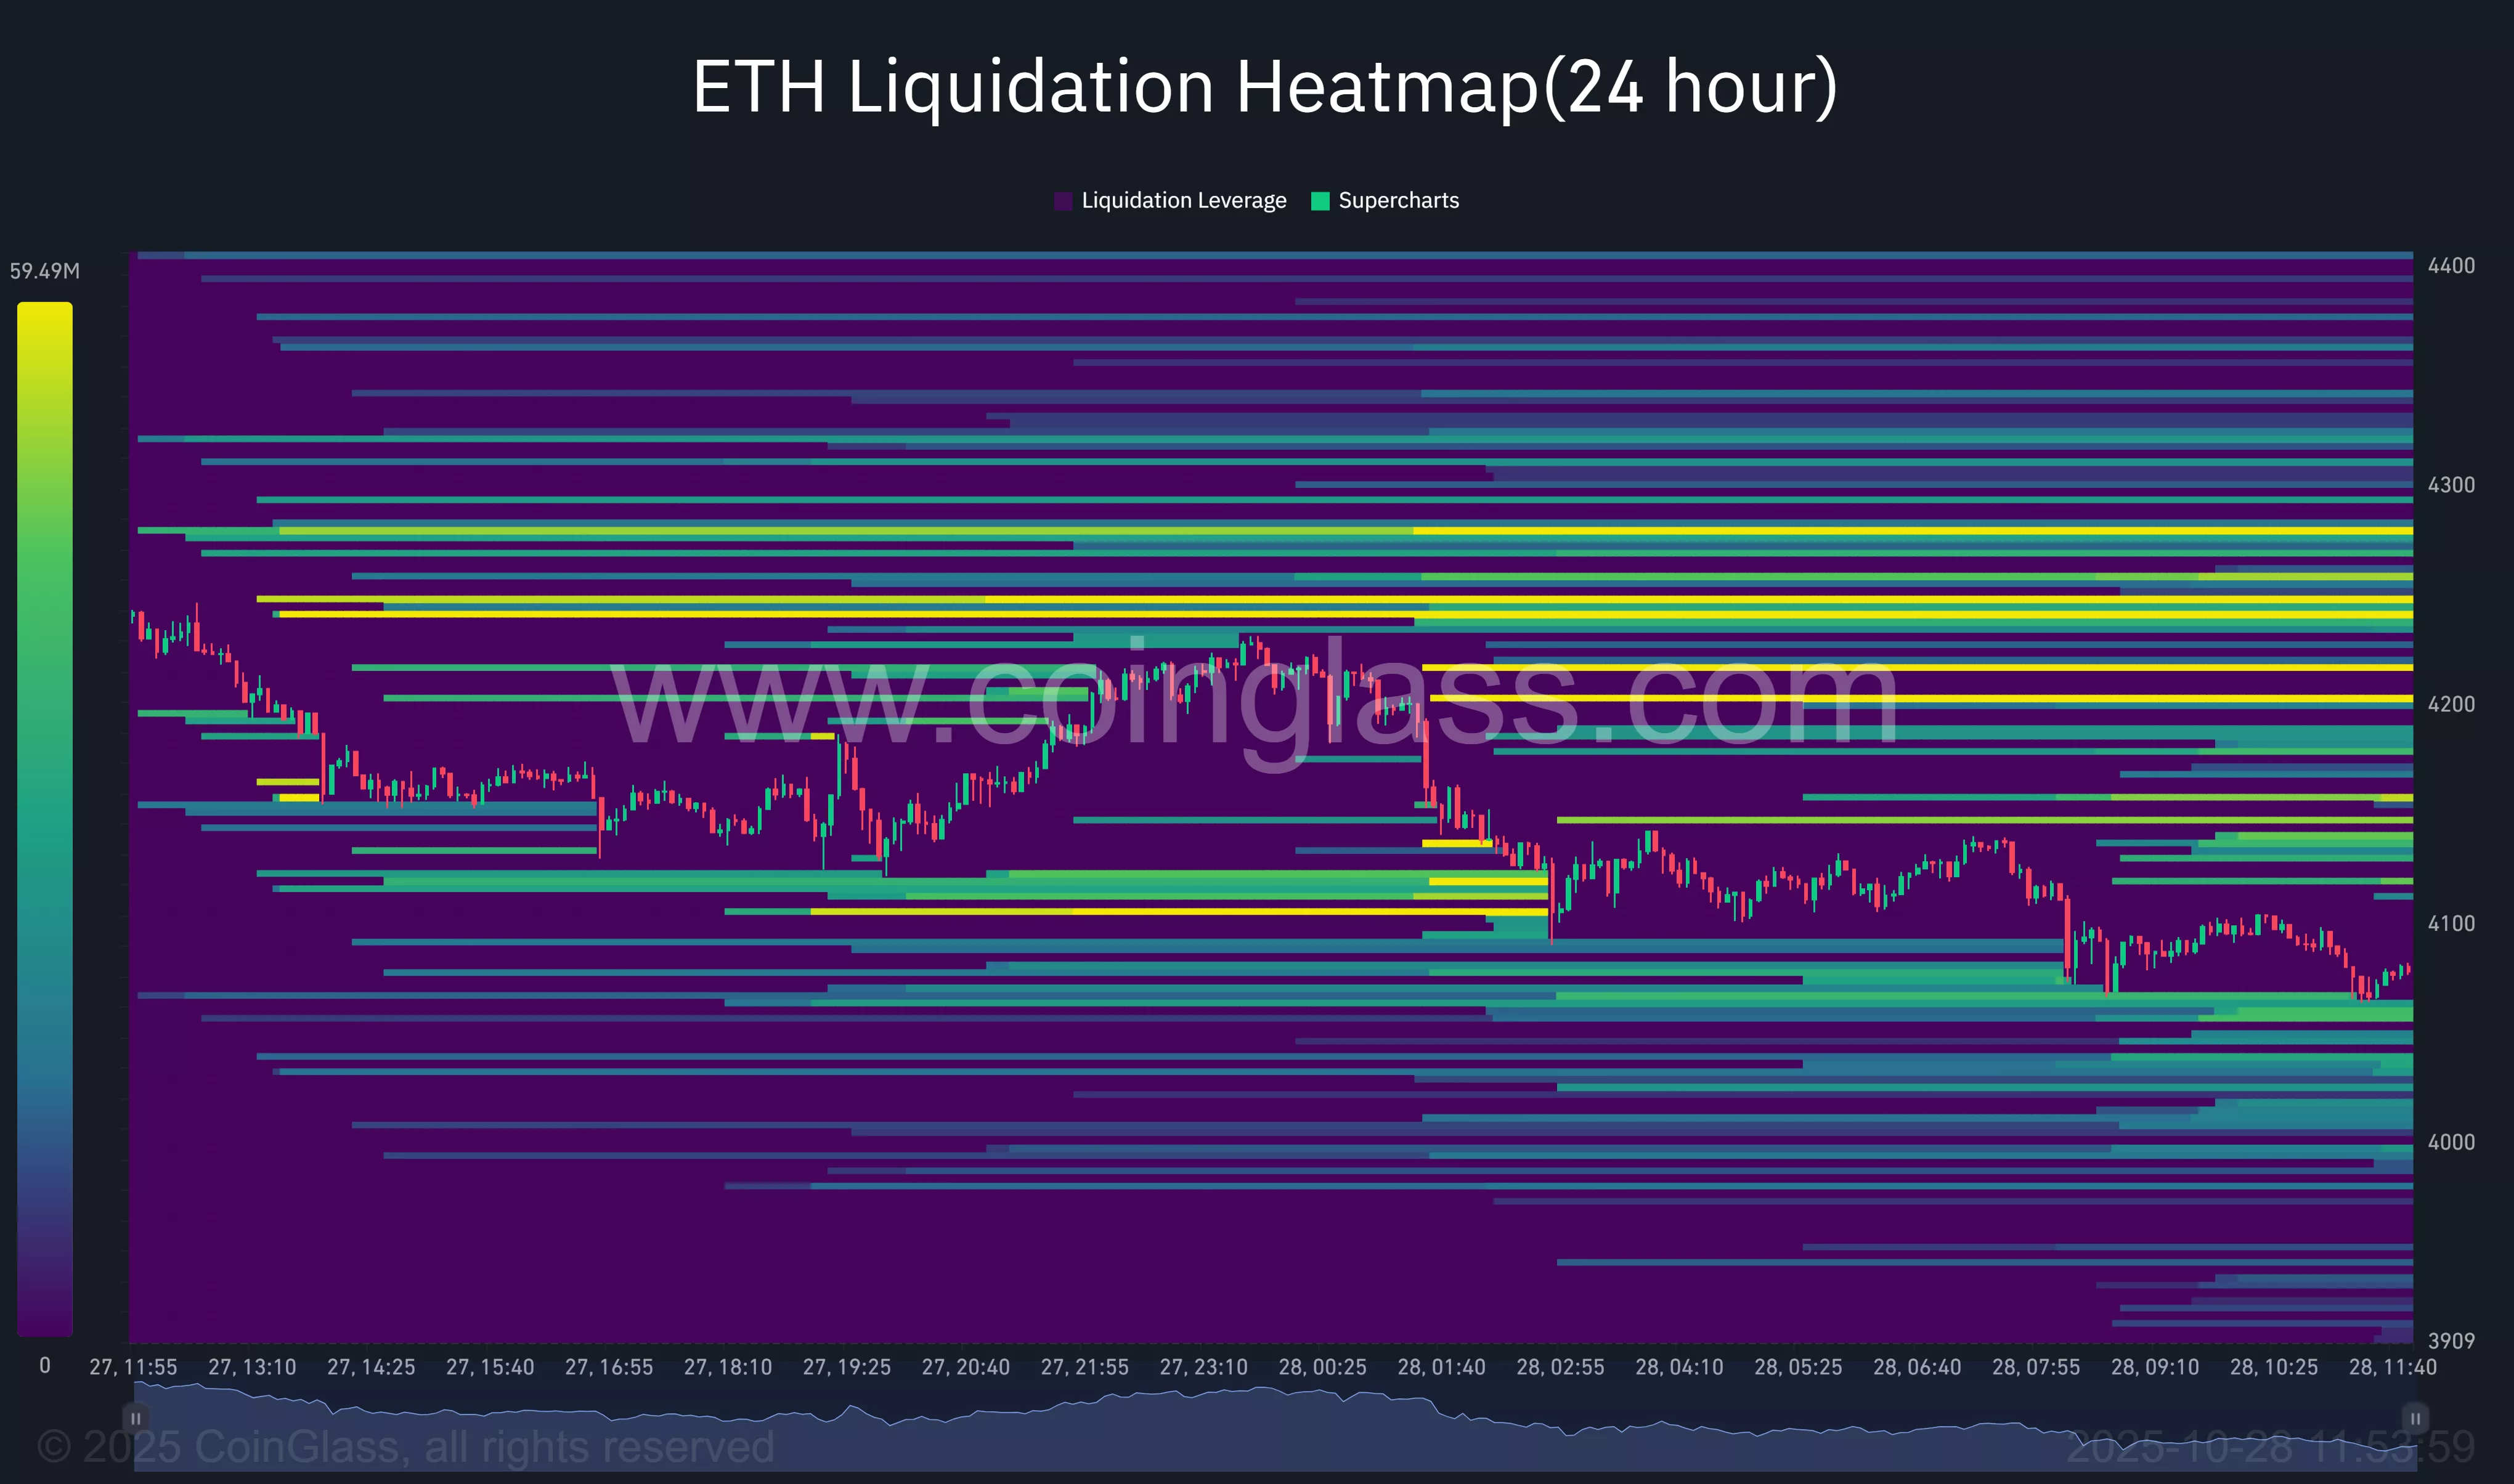
Source: Coinglass
A clean breakout of this band could create a short squeeze, forcing the liquidation of overleveraged positions and accelerating price appreciation. With so much liquidity piling up in this zone, bulls could find the momentum needed to push ETH towards the $4,400-$4,500 target range.
On the downside, the heatmap shows significant liquidation interest between $4,000 and $3,900, suggesting this region could act as a strong demand zone in the near term.
If Ethereum enters the region, buyers are likely to intervene aggressively to protect key supports. However, if ETH dips below $3,900, the chart will begin to thin, indicating reduced liquidity and limited buy-side interest, potentially exposing the token to increased volatility and increased losses, possibly dragging ETH into the $3,700-$3,650 area.
read more: Ethereum ETF reaches second consecutive week of outflows with $555 million in outflows
Disclosure: This article does not represent investment advice. The content and materials published on this page are for educational purposes only.