


Ethereum price action continues to reflect fragile market structure as traders weigh weakening momentum against key technical thresholds. The asset is currently trading around $2,050 after a sharp decline and remains trapped in a narrow consolidation range.
This pause follows a broader bearish trend that began after the previous cycle’s peak near $4,900. As a result, market participants are now focused on whether this range indicates accumulation or continued decline.
Market structure suggests continued weakness
The price structure shows a clear pattern of falling highs and falling lows, reinforcing the bearish macro outlook. Additionally, Ethereum is still below the 100 and 200 exponential moving averages, currently acting as overhead resistance. This positioning limits price gouging attempts and increases seller control.
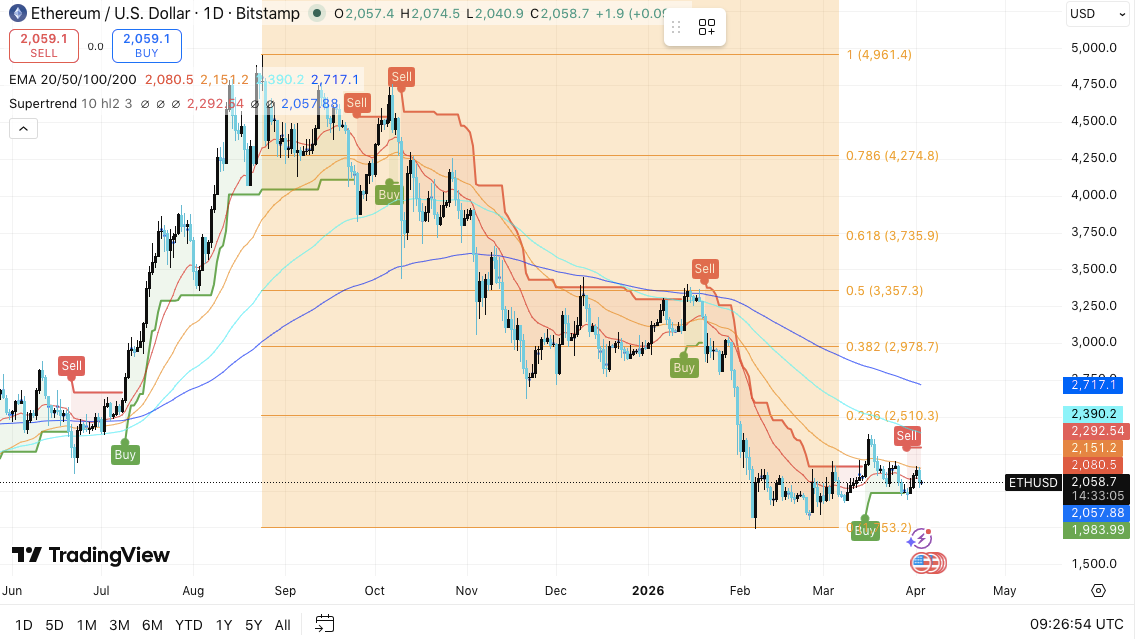
Additionally, technical indicators support this cautious stance. The supertrend indicator remains in bearish territory and outperforms the price movement. This setup often indicates that downward pressure will continue unless a strong reversal occurs.
Additionally, Fibonacci levels further emphasize weakness. The price has already lost the 0.236 retracement near $2,510.
Related: $XRP Price Prediction: $13 Trillion Payments Giant Allows Holding $XRP like cash
This loss suggests a failure of the recovery phase rather than a sustainable recovery. As a result, Ethereum is trading well below a major retracement zone, confirming a weak structure.
Key levels define next moves
The current $2,000 to $2,150 range serves as a key decision zone. Support near $2,000 is very important for short-term stability.
However, if it falls below this level, it could quickly reach $1,900 or even $1,800. These zones represent strong demand, but are also potential liquidity targets.
On the upside, resistance between $2,150 and $2,200 remains strong. This zone coincides with the moving average and the previous support level. Therefore, bulls need to regain this range to change the short-term momentum.
Moreover, if the price continues to rise above $2,300, bullish sentiment will strengthen. This scenario could pave the way to $2,700, where higher timeframe resistance awaits.
Adding context with derivatives and flow data
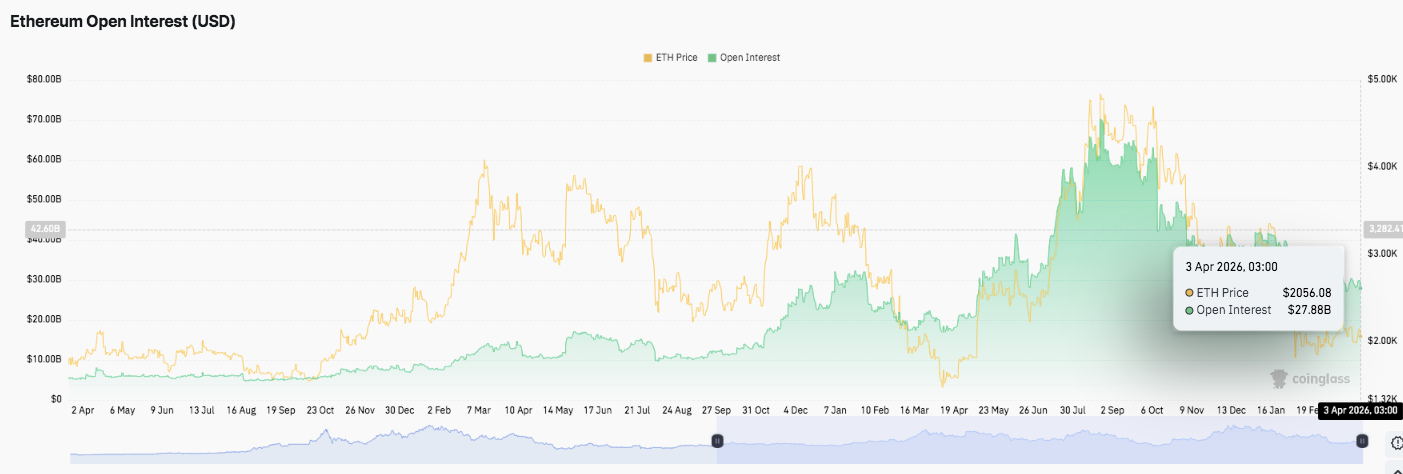
The trend in open interest shows that participation in the Ethereum derivatives market is increasing over time. However, recent data shows that cooling activity is occurring after the previous peak. This decline suggests reduced speculative pressure and cautious positioning.
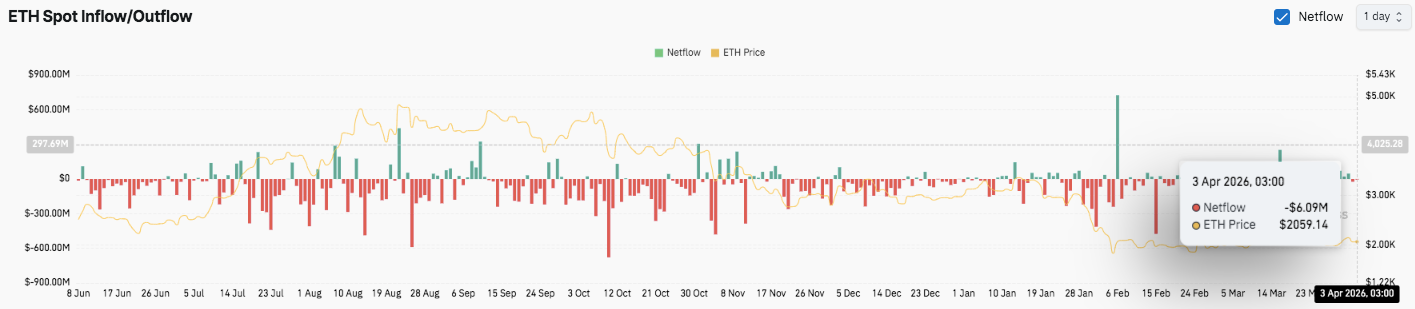
Spot flow data, on the other hand, highlights a more concerning situation. Sustained outflows are predominant, indicating continued selling pressure. While we are seeing short-term spikes in inflows, we are unable to change broader trends.
As a result, capital movements reflect hesitation rather than strong accumulation. This pattern is consistent with the current consolidation phase and weak recovery attempts.
Technical outlook for Ethereum price
Ethereum’s key levels remain well-defined as the price stabilizes around key decision zones. The market is currently trading within a narrow range between $2,000 and $2,150, with volatility continuing to reduce. This structure suggests that the direction is likely to be driven by liquidity and macro sentiment, and a breakout could occur soon.
Top level: $2,150 and $2,200 are the immediate hurdles. If it continues to break out of this range, it could pave the way to $2,300 and $2,400. If the momentum strengthens further, the price could extend towards $2,700, which coincides with the resistance zone on the higher timeframe.
Related: Cartesian Price Prediction: CTSI Soars 65% — Can Bulls Break Above $0.045?
Lower price level: $2,000 remains the major support to watch. A break below this level could trigger a move towards $1,950 and $1,900. If the bearish pressure accelerates, $1,800 will become the next major liquidity zone.
Upper limit of resistance: The $2,200 area, supported by the EMA confluence, remains the most important level for a near-term bullish turn. Sellers maintain control of the broader trend until price regains this area.
Technically, Ethereum continues to trade within consolidation even after the sharp drop. This pattern is similar to a bearish flag, where the price is compressed before a possible continued move. Furthermore, it reinforces the idea that a position below a major Fibonacci level is a weak recovery phase rather than a solid reversal.
Will Ethereum rise further?
Ethereum’s near-term outlook will largely depend on how the price reacts around the $2,000 support zone. If buyers sustain this level and break above $2,150, momentum could head towards a relief rally. In that case, ETH could challenge $2,300 and even $2,400 in the short term.
However, failure to hold $2,000 will likely confirm bearish continuation. As a result, the price could fall towards $1,900 and test $1,800 where stronger demand could emerge.
In addition, market trends add further uncertainty. Cooling open interest suggests a decline in speculative activity, while continued spot outflows suggest cautious investor sentiment. These factors could limit the strength of the upside unless inflows return with confidence.
For now, Ethereum remains in a pivotal range. The compression continues to progress and a decisive move above $2,200 or below $2,000 will likely determine the next trend.
Related: Cardano Price Prediction: Foundation Reports 45% Asset Drop, ADA Tests $0.24