


The cryptocurrency market is currently witnessing a major shift in momentum. After a period of heightened volatility, bitcoin price withdrew to $65,000 This means a significant cooling-off period for the world’s largest digital asset. The move comes as traders digest recent macro data and institutional changes, leading to what analysts describe as a “textbook consolidation.”
Is Bitcoin price still bullish?
Indeed, the overall structure remains unchanged, but the short-term outlook has shifted to neutral-bearish. While the drop to $65,000 is causing concern among retail investors, technical indicators suggest this is a “healthy correction” needed to shake out over-leveraged positions before potentially heading towards historic highs.
Bitcoin Price Today: Understanding $65,000 Support
Recent price trends are $BTC-USD chart shows the $65,000 area acting as a major psychological and technical floor.
Why did Bitcoin fall?
Several factors are contributing to this retracement.
- Institutional profit taking: After a strong start to 2026, many institutional desks have booked profits.
- Macro uncertainty: Announcements of new tariffs and changing expectations from the Federal Reserve have pushed investors toward defensive assets such as gold.
- Whale activities: On-chain data from platforms like Glassnode shows an increase in currency inflows from large holders, indicating a temporary distribution phase.
Bitcoin Price Analysis: Consolidation or Breakdown?
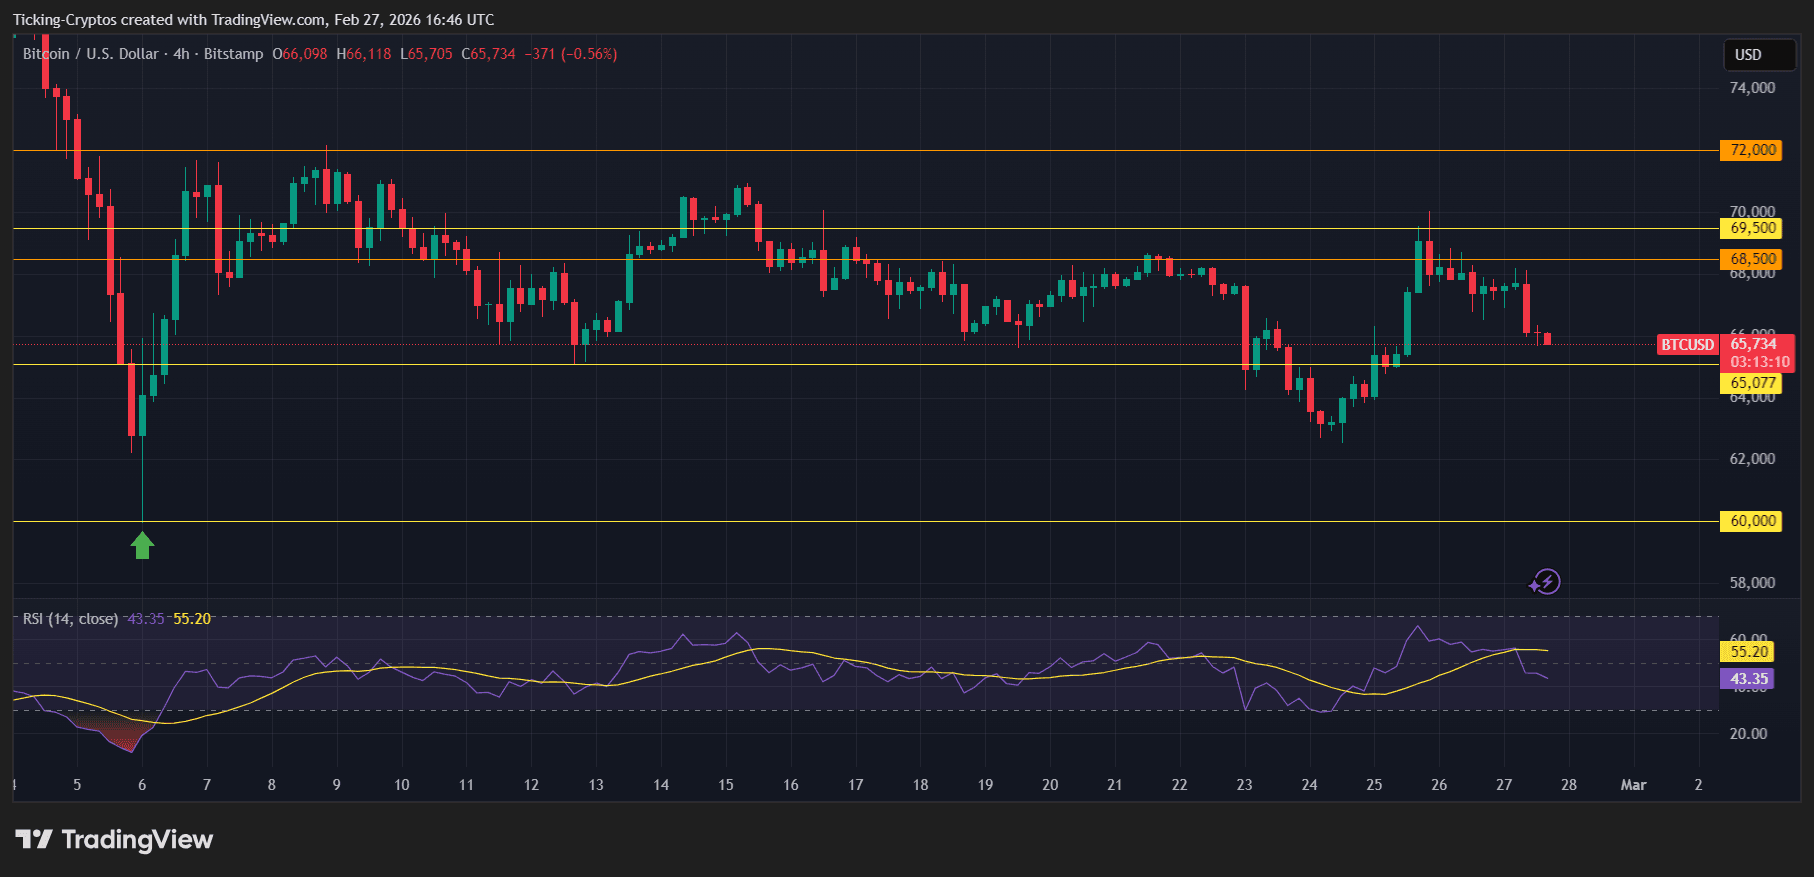
An analysis of the recent 4-hour and daily charts reveals something obvious. down channel pattern. Bitcoin recently peaked near $70,000 before falling into its current range.
Key technical indicators:
- RSI (Relative Strength Index): The RSI is currently hovering around 45, indicating that Bitcoin is neither oversold nor overbought. This “middle ground” supports the narrative of lateral integration.
- Support and resistance:
- Immediate support: $65,000 (Psychology)
- Strategic support: $62,000 (100 week moving average)
- Short term resistance: $68,500 (20-day EMA)
- volume: Trading volumes are stable, which is typical during the consolidation phase. A sudden spike in trading volume at these levels would be required to confirm a breakout in either direction.
Bitcoin price prediction: where is it? $BTC Price direction?
To predict Bitcoin’s next move, you need to look at both liquidity and sentiment. the current, index of fear and greed It’s in the realm of “extreme fear.” Paradoxically, for contrarian traders, this often indicates a potential bottoming process.
Scenario A: Bullish rebound
If Bitcoin maintains its hold above $64,200 and breaks through the $68,000 resistance, the next target will be $71,500 and ultimately the psychological barrier of $75,000. This will likely be driven by a new influx of spot ETFs.
Scenario B: Bearish extension
Definitive daily closing price below $62,000 There will be concerns. Such a move could trigger a “liquidity cascade” that could push the price towards the $58,000 support zone that served as a major floor in late 2024.